|
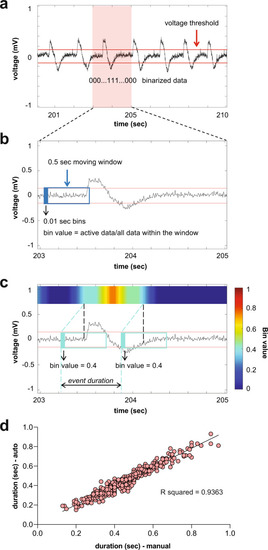
Automated interictal-like event quantification.a A representative LFP recording with interictal-like events. A voltage threshold (0.15–0.25 mV, depending on the noise level) was set for event detection. Data were binarized by threshold: super-threshold data points were scored as 1, and under-threshold data points were scored as 0. b A data binning method was used for automated quantification of interictal-like events: 0.01 s binning in 0.5 s time window. In each window, the value of the first bin was calculated, which is the ratio of active data points to the number of total data points within the window. c Color raster plots were created according to the raster score. A raster score threshold (0.2–0.4) was set to define the start and end of an event. d Comparison between interictal-like event durations measured automatically and manually. A 10 s representative epoch from each recording will be used as a testing sample to optimize the algorithm. Voltage and raster score thresholds were chosen when the difference between automated and manual results is <3% of manual measurements.
|