|
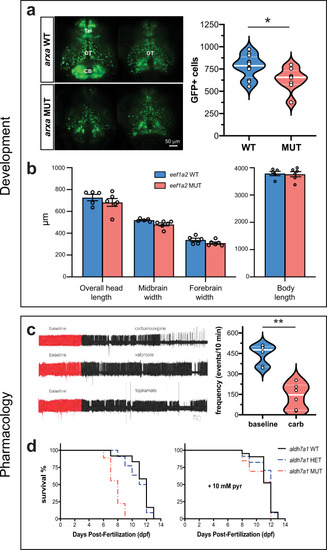
Developmental and pharmacological characterization.a Representative images of dlx-GFP expressing interneurons in arxa MUT larvae (N = 8) and WT sibling larvae (N = 12) obtained from volumetric light-sheet imaging microscopy. Unpaired two-tailed t test *p = 0.0268; t = 2.411, df = 18). b High-resolution images of larvae were taken using a SteREO Discovery.V8 microscope (Zeiss) and overall head length, midbrain width, forebrain width and body length were quantified in eef1a2 MUT larvae (N = 6) and WT sibling larvae (N = 5). c Representative 1 hr LFP traces from gabrb3 MUT larvae exposed to AEDs. The first ∼10 min of the recording (in red) represents baseline. Drugs were bath applied at a concentration of 0.5 mM; N = 3–6 larvae per drug. Results from carbamazepine treatment shown as violin plot. Unpaired two-tailed t test **p < 0.0001; t = 6.344, df = 10). d Kaplan–Meier survival curves for aldh7a1 WT, aldh7a1 HET and aldh7a1 MUT larvae treatment with 10 mM pyrodixine (pyr) or vehicle for 30 mins daily starting at 4 dpf. Median survival for vehicle-treated aldh7a1 WT = 12 dpf (N = 12), aldh7a1 HET = 11.5 dpf (N = 22 larvae) and aldh7a1 MUT = 8 dpf (N = 9 larvae). Median survival for 10 mM pyridoxine (pyr) treated larvae for aldh7a1 WT = 12 dpf (N = 21 larvae), aldh7a1 HET = 12 dpf (N = 34 larvae) and aldh7a1 MUT = 12 dpf (N = 13 larvae). Data displayed as mean ± SEM.
|