
- Title
-
Live Monitoring of Blastemal Cell Contributions during Appendage Regeneration
- Authors
- Tornini, V.A., Puliafito, A., Slota, L.A., Thompson, J.D., Nachtrab, G., Kaushik, A.L., Kapsimali, M., Primo, L., Di Talia, S., Poss, K.D.
- Source
- Full text @ Curr. Biol.
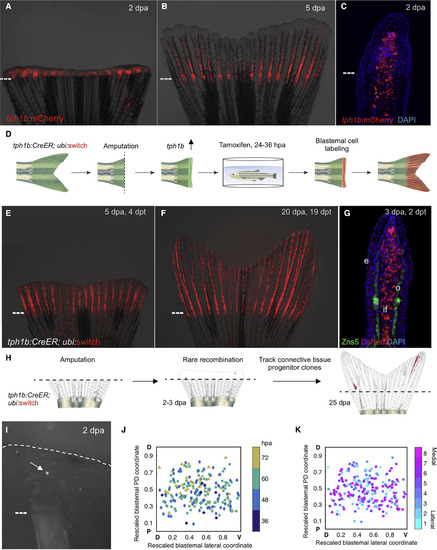
tph1b Regulatory Sequences Permit Clonal Analysis of Blastemal Cells (A and B) tph1b:mCherry reporter expression in regenerating fins at 2 (A) and 5 (B) days post-amputation (dpa). (C) Section of tph1b:mCherry fin at 2 dpa. (D) Design of lineage tracing experiments in (E and F). (E and F) tph1b:CreER; ubi:switch fins were treated with 4 μM tamoxifen from 24–36 hr post-amputation (hpa) and imaged at 5 (E) and 20 (F) dpa. (G) Section through 3-dpa lineage-labeled tph1b:CreER; ubi:switch fin, stained for osteoblasts (green) using the Zns5 antibody as well as nuclei (DAPI, blue). e, epidermis; o, osteoblasts, if, intraray fibroblasts. (H) Design of clonal analysis experiments in (I–K). (I) Representative image of a single labeled blastemal cell (arrow) in a 2-dpa blastema. (J) Two-dimensional projection of all initial labeling events onto a rescaled virtual blastema, with rescaled lateral coordinates (D, dorsal; V, ventral) and initial PD coordinates (amputation plane, P, proximal; distal tip, D, distal), color coded by time of detection of the initial labeling event. (K) Two-dimensional projection of all initial labeling events onto a rescaled virtual blastema, color coded by ray of origin (1 indicates lateral-most ray, 8 indicates the medial ray). Dashed lines, amputation planes. See also Figure S1. |
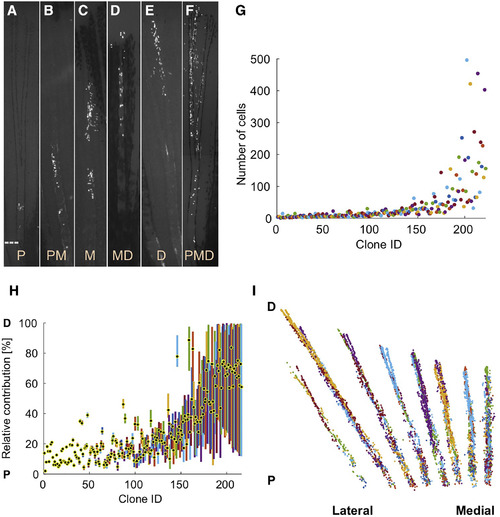
Extreme Heterogeneity in Blastemal Cell Clone Size and PD Contribution (A–F) Connective tissue clones initially labeled at 1.5–3 dpa and imaged at 28 dpa, showing examples of proximal (P; A), proximomedial (PM; B), medial (M; C), mediodistal (MD; D), and distal (D; E) clones, as well as clones spanning the PD axis (PMD; F). Dashed line, amputation plane. (G) Final number of cells in each clone. (H) Plot of the relative position along the PD axis in which the clone progeny are distributed, normalized for regenerated ray length (amputation plane to distal tip) as a percentage. The centroid position of each clone is indicated with a black and yellow dot. (I) Cumulative 2D projection of 216 clones onto a virtual fin lobe at the final time point. P, proximal; D, distal. See also Figure S2, Table S1, and Movie S1. |
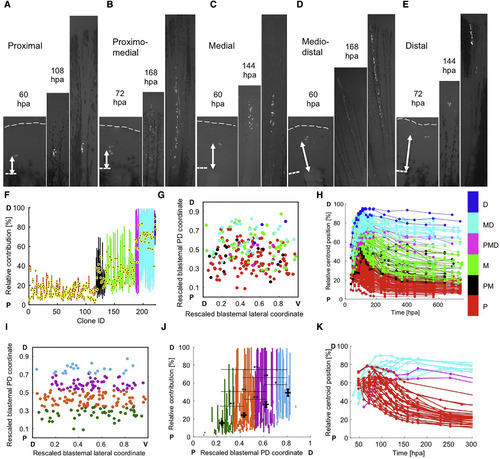
Evidence that Blastema Connective Tissue Progenitors Assemble a PD Pre-pattern (A–E) Examples of clone expansion over time in hours post-amputation (hpa), for proximal (A), proximomedial (B), medial (C), mediodistal (D), and distal (E) clones. The final image in each panel is the final time point, collected at 25–29 dpa. Dashed lines, amputation planes. (F) The relative positions of clones in Figure 2G grouped and color coded by final PD contribution, used for retrospective assessment of initial labeling position: proximal (red), proximomedial (black), medial (green), mediodistal (cyan), distal (blue), and spanning the PD axis (magenta). The centroid position of each clone is indicated with a black and yellow dot. (G) Two-dimensional projection of all initial labeling events onto a rescaled virtual blastema, with rescaled lateral (D, dorsal; V, ventral) and PD (P, proximal; D, distal) coordinates, color coded by final PD occupancy as in (F). (H) The relative position of each clone in the regenerating ray over time, color coded by PD contribution. Relative position is defined as the mean distance to the distal plane, divided by the mean distance from amputation plane to distal tip, multiplied by 100. (I) Two-dimensional projection of all initial labeling events onto a rescaled virtual blastema, grouped and color coded by initial cell location in the blastema: 15%–33.75% (green, bin 1), 33.75%–52.5% (orange, bin 2), 52.5%–71.25% (purple, bin 3), and 71.25%–90% (light blue, bin 4). (J) Final relative position of each clone, including the mean calculated centroid. Clones are grouped and color coded by their initial cell location in the blastema, as in (I). ∗p < 0.01, ∗∗p < 0.005; Mann-Whitney two-tailed test, n = 216 clones total; n = 47 (bin 1), n = 90 (bin 2), n = 56 (bin 3), and n = 23 (bin 4). (K) Cells initially labeled in the proximal half of the blastema that contribute to mediodistal regions, and cells initially labeled in the distal half of the blastema that contribute to proximal regenerate tissue, were identified and their relative centroid positions were plotted over time, color coded by final PD contribution: proximal (red), mediodistal (cyan), and spanning the PD axis (magenta). Presence of these clones indicate a capacity to mix or non-conform to the pre-pattern. Dashed lines, amputation planes. See also Figure S3. |
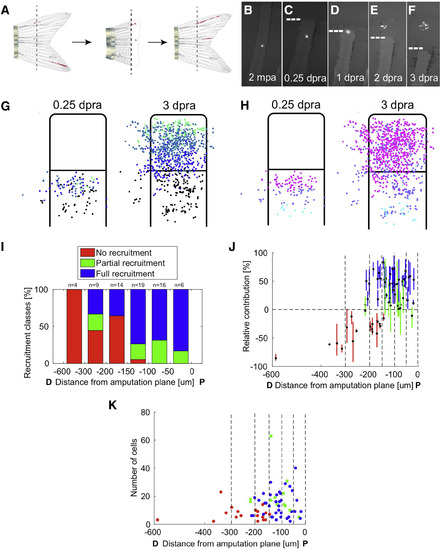
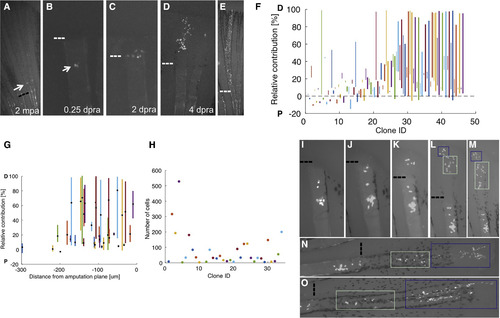
Recruitment Dynamics of Resident Cells during Blastema Formation (A) Diagram of re-amputation experiment visualizing recruitment of labeled resident cells to form a new blastema and regenerated structures. (B–F) Re-amputation experiment visualizing recruitment of labeled cells to form a new blastema, shown at 2 months post-initial amputation (mpa) (B), and 0.25 (C), 1 (D), 2 (E), and 3 days post-re-amputation (dpra) (F). (G and H) Retrospective (G) and prospective (H) analyses of labeled cell recruitment following amputation injury, shown as cumulative 2D projections of cells from 68 clones onto a rescaled virtual stump and blastema at 0.25 or 3 dpa, as indicated. For retrospective analyses, the clone centers of mass were binned by their relative positions at 3 dpra, color coded from proximal (below the amputation plane) to distal (tip of blastema) as black, blue, light blue, and green (G). For prospective analyses, clones’ centers of mass were binned by their relative positions at 0.25 dpra, color coded from furthest to closest to amputation plane as cyan, purple, or magenta (H). Resident cells are recruited toward the injury site and proliferate to occupy most areas of the blastema. (I) Probabilities for recruitment to the blastema for clones binned by their initial distance (in μm) from the amputation plane. Cell contributions were categorized as fully recruited to the blastema with no progeny below the amputation plane (full recruitment, blue), progeny contributing both to the blastema and below the amputation plane (partial recruitment, green), or contribution to the blastema (no recruitment, red). Generally, cells near the amputation plane have a higher probability of contributing to the blastema, although the distance from amputation plane is not indicative of extent of contribution. (J) The relative contributions of progeny to below the amputation plane (below 0%) or to the blastema (above 0%) at 3 dpra, relative to the cells' initial distances (in μm) from the amputation plane. Cell contributions are color coded by full recruitment (blue), partial recruitment (green), or no recruitment (red). Clones were binned by their initial distance (in μm) from the amputation plane (vertical dashed lines). Cells generally have a higher probability of recruitment to the blastema if they are closer to the site of injury, although the distance from the amputation plane does not determine the extent or final PD position of their contributions. (K) The final number of cells in each clone generated by resident cells at 3 dpra, relative to the initial distance (in μm) of the resident cell from the amputation plane. Cell contributions are color coded by full recruitment (blue), partial recruitment (green), or no recruitment (red). Clones were binned by their initial distance (in μm) from the amputation plane (vertical dashed lines). Cells that contribute to the blastema proliferate to different extents, with no evidence of a direct association with distance of the resident cell from the amputation plane. See also Figure S4 and Movies S2 and S3. |
Amputation Resets the Positional Information of Resident Cells (A–E) Re-amputation experiment visualizing recruitment of labeled resident cells to form a new blastema and regenerated structures, shown at 2 months post-initial amputation (mpa), and 0 (A), 0.25 (B), 2 (C), 4 (D), and 28 days post-re-amputation (dpra) (E). (F) Comparison of respective first and second clones’ relative PD contributions to regenerated ray lengths. Second clones’ relative contributions plotted as bold lines. Cells that had been part of established proximal clones could contribute to structures extending throughout the PD axis of the second regenerate. (G) Distance of the labeled cell proximal to the second amputation plane (in μm) plotted against the PD contribution of the resultant clone after the second amputation (in μm). Distance of recruited cells to the amputation plane does not directly correlate with the final PD contribution to regeneration (linear regression, R = –0.2586, p = 0.0826). (H) Relative PD contribution and position of clone centroid (black dot) attributable to single resident cells after re-amputation, plotted by the distance of the cell (in μm) from the second amputation plane. Recruited cells varied in their relative contributions to the regenerate, and these contributions did not correlate with their distance from the amputation plane (linear regression, relative contribution R = 0.18, p = 0.298; centroid R = 0.25, p = 0.147). (I–O) Re-amputation experiment visualizing recruitment of labeled connective tissue cells from a P clone to form a new blastema, shown at 0.5 (I), 1 (J), 2 (K), 3 (L), 4 (M), 6 (N), and 9 (O) days post-re-amputation (dpra). Blue and green boxes track progeny of cells from the 3-dpra blastema. Dashed lines, amputation planes. See also Figure S5. |
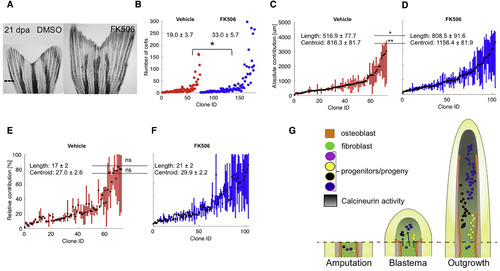
Calcineurin Enhances Regeneration by Scaling Clone Size (A) Representative images of 21-dpa tph1b:CreER; ubi:switch fins treated with vehicle (DMSO) or FK506 from 3 to 21 dpa. Dashed line, amputation plane. (B) Final numbers of cells in clones from vehicle- (red) or FK506-treated (blue) zebrafish at 21 dpa. ∗p < 0.05, Mann-Whitney one-tailed test, n = 73 (vehicle), n = 104 (FK506). (C and D) Absolute positions along the PD axis (in μm) indicating clone contributions, for clones from vehicle- (C) or FK506-treated (D) fish. The centroid position of each clone is indicated with a black dot. Clone length is significantly increased in clones from FK506-treated fish, ∗p < 0.05, Mann-Whitney one-tailed test, n = 73 (vehicle), n = 104 (FK506). Centroid position is significantly distalized in clones from FK506-treated fish, ∗p < 0.005, Mann-Whitney one-tailed test, n = 73 (vehicle), n = 104 (FK506). (E and F) Relative position of each clone, including the mean calculated centroid of clones from vehicle- (E) or FK506-treated (F) fish. Clone length and centroid positions are not significantly changed between the two groups, ns, not significant. (G) Model for blastemal proliferation dynamics. Left: cells are recruited to form the blastema from regions proximal to the amputation plane. Middle: by 3 dpa, blastemal connective tissue progenitors establish preferences to contribute to distinct PD regions based on their coordinates. Right: the connective tissue compartment regenerates from progenitors in the blastemal approximate pre-pattern. Calcineurin activity increases as regeneration proceeds (dark gradient) and progressively lowers proliferation of fibroblast progeny. Blocking Calcineurin activity with FK506 releases the brake on cell division and clone cell number, scaling up the size of regenerated skeletal elements. See also Figure S6. |
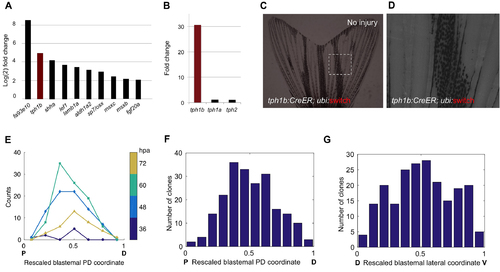
Labeling Dynamics of tph1b+ Blastemal Cells, Related to Figure 1 (A) Fold-changes (log2) of transcript levels during fin regeneration at 4 days post amputation (dpa) compared to uninjured fins, from RNA-Seq analysis. (B) Fold-changes of tph1a, tph1b, and tph2 at 4 dpa, from RNA-Seq analysis. (C and D) tph1b:CreER; ubi:switch caudal fins show no detectable labeling without tamoxifen treatment or amputation (red channel). Image in (D) is magnified view of the box in (C). (E) Number of spontaneous recombination events, color-coded by time of detection of initial labeling event. Labeling events between 48-72 hpa were evenly distributed across the PD axis. Labeling events detectable at 36 hpa had a medial skew. (F) Histogram of rescaled PD positions of labeling events. A triples test for symmetry of the distribution yields P = 0.071. (G) Histogram of rescaled dorsoventral (DV) position of labeling events. A triples test for symmetry yields P = 0.7. |
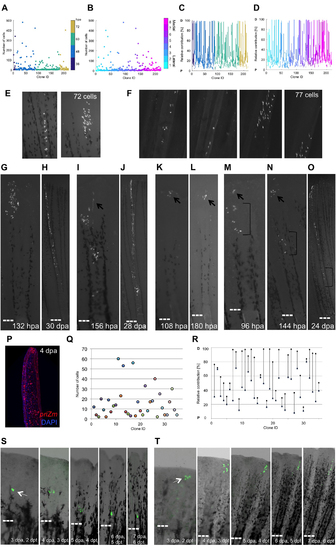
Heterogeneity of Contributions by Blastemal Fibroblast Progenitors, Related to Figure 2 (A) Final number of cells in each clone, sorted by the detection time of initial labeling events: 36 hpa (navy blue), 48 hpa (light blue), 60 hpa (turquoise), or 72 hpa (tan). (B) Final number of cells in each clone, sorted by ray of origin. Cyan (lateral, ray 1) through magenta (medial, ray 8). (C) Relative contribution along the PD axis by individual clones, sorted by the detection time of initial labeling event, as in (A). (D) Relative contribution along the PD axis by individual clones, sorted by the ray of origin, as in (B). P, proximal; D, distal. (E) An example of a clone at 10 dpa represented in 2 images, imaged using a Zeiss AxioZoom microscope. Images were segmented in FIJI software, with a total of 72 cells counted. (F) Zeiss confocal Z-stack images for the same clone as in (E). Images were segmented at each plane in FIJI software, with a total of 77 cells counted. Cell counts from AxioZoom microscope images on average were 95.8% those of counts from optical sections of the same clone (n = 11). (G and H) Clonal expansion through continual proliferation, shown at 132 hpa (G) and 30 dpa (H). Twenty-nine of the tracked clones expanded in this manner. (I and J) Specific morphogenetic process is indicated by preferential creation of one branch of a bifurcated ray, shown at 156 hpa (I) and 28 dpa (J). Arrow in (I) indicates early constituents of the branch. Fifteen tracked clones behaved in this manner. |
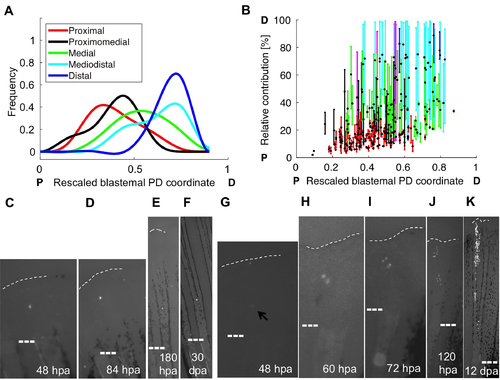
Some Blastemal Cells do not Conform to a PD Pre-Pattern, Related to Figure 3 (A) Fitted curves for frequency of respective PD contributions of fibroblast clones relative to their rescaled PD position in the blastema at the time of detected initial labeling, color-coded by final relative PD contribution. Cells labeled containing proximal and proximomedial coordinates give rise to more proximal clones, whereas medial, mediodistal, and distal cells give rise to more distal clones. (B) The relative positions of clones color-coded by final PD contribution, plotted against their respective initial rescaled PD coordinate, and color-coded by final PD contribution: proximal (red), proximomedial (black), medial (green), mediodistal (cyan), distal (blue), and spanning the PD axis (magenta). The centroid position of each clone is indicated with a black and yellow dot. P, proximal; D, distal. (C–F) Example of a cell labeled in the distal half of the blastema that shows no evidence of division and occupies a proximal region of regenerated fin, shown at 48 hpa (C), 84 hpa (D), 180 hpa (E), and 30 dpa (F). (G–K) Example of a cell labeled in the proximal blastema that gives rise to progeny occupying mediodistal tissue, shown at 48 hpa (G), 60 hpa (H), 72 hpa (I), 120 hpa (J), and 12 dpa (K). |
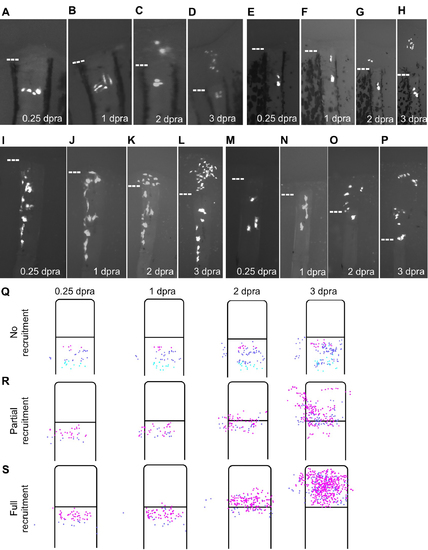
Behaviors of Resident Cells Recruited to Blastema after a Re- Amputation, Related to Figure 4 (A–D) Cells aligned at a similar PD position are differentially recruited to form the blastema. Two cells are recruited above the amputation plane, where they proliferate and contribute, and three cells shift laterally and cluster together, remaining below the amputation plane, shown at 0.25 (A), 1 (B), 2 (C), and 3 dpra (D). (E–H) One resident cell is recruited to the blastema, where it contributes to its middle portion at 3 dpra. A nearby clonal partner remains below the amputation plane, dividing and expanding moderately. Shown at 0.25 (E), 1 (F), 2 (G), and 3 dpra (H). (I–L) A large cluster of resident connective tissue cells responds to an amputation injury. Some cells near the amputation plane are recruited to form the blastema, while other cells further from the amputation plane shift their positions and/or morphologies. Even if resident cells are not recruited to form the blastema, they can still respond in some way to injury. Shown at 0.25 (I), 1 (J), 2 (K), and 3 dpra (L). (M–P) A whole cluster of cells at varying distances from the amputation plane is recruited toward the amputation plane in a proximal-to-distal sequence. No labeled cell remains below the amputation plane, and recruited fibroblasts generate various regions of the blastema by 3 dpra. Shown at 0.25 (M), 1 (N), 2 (O), and 3 dpra (P). (Q–S) Prospective analyses of labeled resident cell recruitment following amputation injury, shown as cumulative 2-D projections of cells from 68 clones onto a rescaled virtual stump and blastema at 0.25, 1, 2, or 3 dpa, as indicated. For prospective analyses, cells were binned by their relative positions at 0.25 dpra, color-coded from furthest to closest to amputation plane as cyan, purple, or magenta. Cells were either not recruited to form the blastema (Q), partially recruited (R), or fully recruited (S). Generally, cells closer to the amputation plane had a higher probability of being recruited, although distance from amputation plane does not determine extent of contribution or progeny’s PD positions at 3 dpra. |
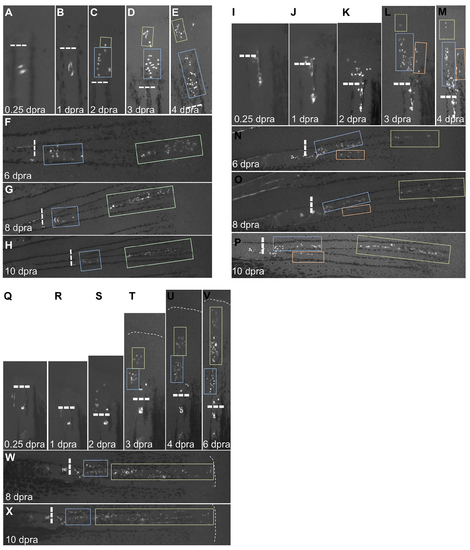
Clones Within a Single Blastema Generally Maintain PD Position Throughout Regeneration, Related to Figure 5 (A–H) Re-amputation experiment visualizing recruitment of labeled connective tissue cells from a P clone to form a new blastema, shown at 0.25 (A), 1 (B), 2 (C), 3 (D), 4 (E), 6 (F), 8 (G), and 10 days post re-amputation (dpra) (H). Blue and green boxes track progeny of cells from the 2 dpra blastema. Dashed lines, amputation planes. (I–P) Re-amputation experiment visualizing recruitment of labeled connective tissue cells from a P clone to form a new blastema, shown at 0.25 (I), 1 (J), 2 (K), 3 (L), 4 (M), 6 (N), 8 (O), and 10 days post re-amputation (dpra) (P). Blue, green, and orange boxes track progeny of cells from the 3 dpra blastema. Dashed lines, amputation planes. (Q–X) Re-amputation experiment visualizing recruitment of labeled connective tissue cells from a P clone to form a new blastema, shown at 0.25 (Q), 1 (R), 2 (S), 3 (T), 4 (U), 6 (V), 8 (W), and 10 days post re-amputation (dpra) (X). Blue and green boxes track progeny of cells from the 3 dpra blastema. Dashed lines, amputation planes. |