
Fig. 4
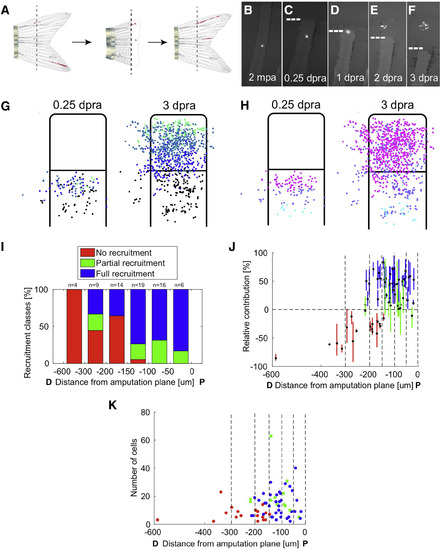
Recruitment Dynamics of Resident Cells during Blastema Formation (A) Diagram of re-amputation experiment visualizing recruitment of labeled resident cells to form a new blastema and regenerated structures. (B–F) Re-amputation experiment visualizing recruitment of labeled cells to form a new blastema, shown at 2 months post-initial amputation (mpa) (B), and 0.25 (C), 1 (D), 2 (E), and 3 days post-re-amputation (dpra) (F). (G and H) Retrospective (G) and prospective (H) analyses of labeled cell recruitment following amputation injury, shown as cumulative 2D projections of cells from 68 clones onto a rescaled virtual stump and blastema at 0.25 or 3 dpa, as indicated. For retrospective analyses, the clone centers of mass were binned by their relative positions at 3 dpra, color coded from proximal (below the amputation plane) to distal (tip of blastema) as black, blue, light blue, and green (G). For prospective analyses, clones’ centers of mass were binned by their relative positions at 0.25 dpra, color coded from furthest to closest to amputation plane as cyan, purple, or magenta (H). Resident cells are recruited toward the injury site and proliferate to occupy most areas of the blastema. (I) Probabilities for recruitment to the blastema for clones binned by their initial distance (in μm) from the amputation plane. Cell contributions were categorized as fully recruited to the blastema with no progeny below the amputation plane (full recruitment, blue), progeny contributing both to the blastema and below the amputation plane (partial recruitment, green), or contribution to the blastema (no recruitment, red). Generally, cells near the amputation plane have a higher probability of contributing to the blastema, although the distance from amputation plane is not indicative of extent of contribution. (J) The relative contributions of progeny to below the amputation plane (below 0%) or to the blastema (above 0%) at 3 dpra, relative to the cells' initial distances (in μm) from the amputation plane. Cell contributions are color coded by full recruitment (blue), partial recruitment (green), or no recruitment (red). Clones were binned by their initial distance (in μm) from the amputation plane (vertical dashed lines). Cells generally have a higher probability of recruitment to the blastema if they are closer to the site of injury, although the distance from the amputation plane does not determine the extent or final PD position of their contributions. (K) The final number of cells in each clone generated by resident cells at 3 dpra, relative to the initial distance (in μm) of the resident cell from the amputation plane. Cell contributions are color coded by full recruitment (blue), partial recruitment (green), or no recruitment (red). Clones were binned by their initial distance (in μm) from the amputation plane (vertical dashed lines). Cells that contribute to the blastema proliferate to different extents, with no evidence of a direct association with distance of the resident cell from the amputation plane. See also Figure S4 and Movies S2 and S3. |