
Fig. S3
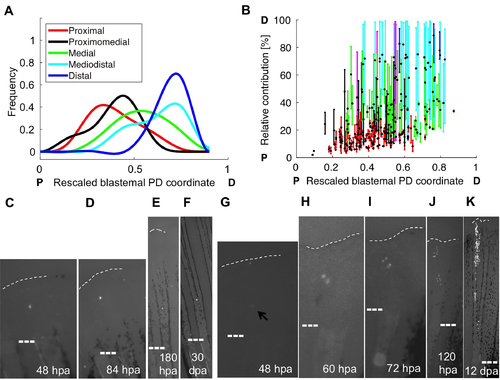
Some Blastemal Cells do not Conform to a PD Pre-Pattern, Related to Figure 3 (A) Fitted curves for frequency of respective PD contributions of fibroblast clones relative to their rescaled PD position in the blastema at the time of detected initial labeling, color-coded by final relative PD contribution. Cells labeled containing proximal and proximomedial coordinates give rise to more proximal clones, whereas medial, mediodistal, and distal cells give rise to more distal clones. (B) The relative positions of clones color-coded by final PD contribution, plotted against their respective initial rescaled PD coordinate, and color-coded by final PD contribution: proximal (red), proximomedial (black), medial (green), mediodistal (cyan), distal (blue), and spanning the PD axis (magenta). The centroid position of each clone is indicated with a black and yellow dot. P, proximal; D, distal. (C–F) Example of a cell labeled in the distal half of the blastema that shows no evidence of division and occupies a proximal region of regenerated fin, shown at 48 hpa (C), 84 hpa (D), 180 hpa (E), and 30 dpa (F). (G–K) Example of a cell labeled in the proximal blastema that gives rise to progeny occupying mediodistal tissue, shown at 48 hpa (G), 60 hpa (H), 72 hpa (I), 120 hpa (J), and 12 dpa (K). |