
Fig. 3
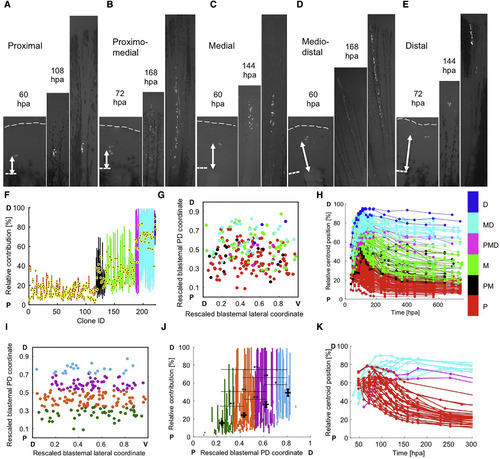
Evidence that Blastema Connective Tissue Progenitors Assemble a PD Pre-pattern (A–E) Examples of clone expansion over time in hours post-amputation (hpa), for proximal (A), proximomedial (B), medial (C), mediodistal (D), and distal (E) clones. The final image in each panel is the final time point, collected at 25–29 dpa. Dashed lines, amputation planes. (F) The relative positions of clones in Figure 2G grouped and color coded by final PD contribution, used for retrospective assessment of initial labeling position: proximal (red), proximomedial (black), medial (green), mediodistal (cyan), distal (blue), and spanning the PD axis (magenta). The centroid position of each clone is indicated with a black and yellow dot. (G) Two-dimensional projection of all initial labeling events onto a rescaled virtual blastema, with rescaled lateral (D, dorsal; V, ventral) and PD (P, proximal; D, distal) coordinates, color coded by final PD occupancy as in (F). (H) The relative position of each clone in the regenerating ray over time, color coded by PD contribution. Relative position is defined as the mean distance to the distal plane, divided by the mean distance from amputation plane to distal tip, multiplied by 100. (I) Two-dimensional projection of all initial labeling events onto a rescaled virtual blastema, grouped and color coded by initial cell location in the blastema: 15%–33.75% (green, bin 1), 33.75%–52.5% (orange, bin 2), 52.5%–71.25% (purple, bin 3), and 71.25%–90% (light blue, bin 4). (J) Final relative position of each clone, including the mean calculated centroid. Clones are grouped and color coded by their initial cell location in the blastema, as in (I). ∗p < 0.01, ∗∗p < 0.005; Mann-Whitney two-tailed test, n = 216 clones total; n = 47 (bin 1), n = 90 (bin 2), n = 56 (bin 3), and n = 23 (bin 4). (K) Cells initially labeled in the proximal half of the blastema that contribute to mediodistal regions, and cells initially labeled in the distal half of the blastema that contribute to proximal regenerate tissue, were identified and their relative centroid positions were plotted over time, color coded by final PD contribution: proximal (red), mediodistal (cyan), and spanning the PD axis (magenta). Presence of these clones indicate a capacity to mix or non-conform to the pre-pattern. Dashed lines, amputation planes. See also Figure S3. |