
Fig. 2
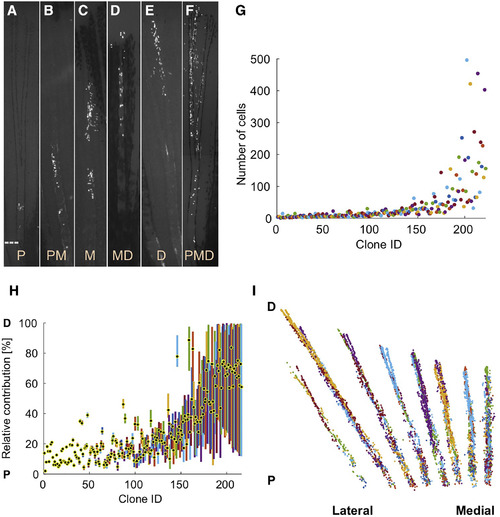
Extreme Heterogeneity in Blastemal Cell Clone Size and PD Contribution (A–F) Connective tissue clones initially labeled at 1.5–3 dpa and imaged at 28 dpa, showing examples of proximal (P; A), proximomedial (PM; B), medial (M; C), mediodistal (MD; D), and distal (D; E) clones, as well as clones spanning the PD axis (PMD; F). Dashed line, amputation plane. (G) Final number of cells in each clone. (H) Plot of the relative position along the PD axis in which the clone progeny are distributed, normalized for regenerated ray length (amputation plane to distal tip) as a percentage. The centroid position of each clone is indicated with a black and yellow dot. (I) Cumulative 2D projection of 216 clones onto a virtual fin lobe at the final time point. P, proximal; D, distal. See also Figure S2, Table S1, and Movie S1. |