
Fig. 5
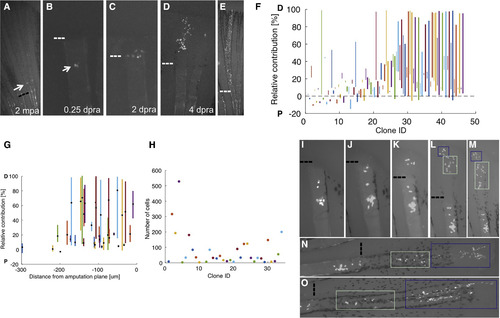
Amputation Resets the Positional Information of Resident Cells (A–E) Re-amputation experiment visualizing recruitment of labeled resident cells to form a new blastema and regenerated structures, shown at 2 months post-initial amputation (mpa), and 0 (A), 0.25 (B), 2 (C), 4 (D), and 28 days post-re-amputation (dpra) (E). (F) Comparison of respective first and second clones’ relative PD contributions to regenerated ray lengths. Second clones’ relative contributions plotted as bold lines. Cells that had been part of established proximal clones could contribute to structures extending throughout the PD axis of the second regenerate. (G) Distance of the labeled cell proximal to the second amputation plane (in μm) plotted against the PD contribution of the resultant clone after the second amputation (in μm). Distance of recruited cells to the amputation plane does not directly correlate with the final PD contribution to regeneration (linear regression, R = –0.2586, p = 0.0826). (H) Relative PD contribution and position of clone centroid (black dot) attributable to single resident cells after re-amputation, plotted by the distance of the cell (in μm) from the second amputation plane. Recruited cells varied in their relative contributions to the regenerate, and these contributions did not correlate with their distance from the amputation plane (linear regression, relative contribution R = 0.18, p = 0.298; centroid R = 0.25, p = 0.147). (I–O) Re-amputation experiment visualizing recruitment of labeled connective tissue cells from a P clone to form a new blastema, shown at 0.5 (I), 1 (J), 2 (K), 3 (L), 4 (M), 6 (N), and 9 (O) days post-re-amputation (dpra). Blue and green boxes track progeny of cells from the 3-dpra blastema. Dashed lines, amputation planes. See also Figure S5. |