
|
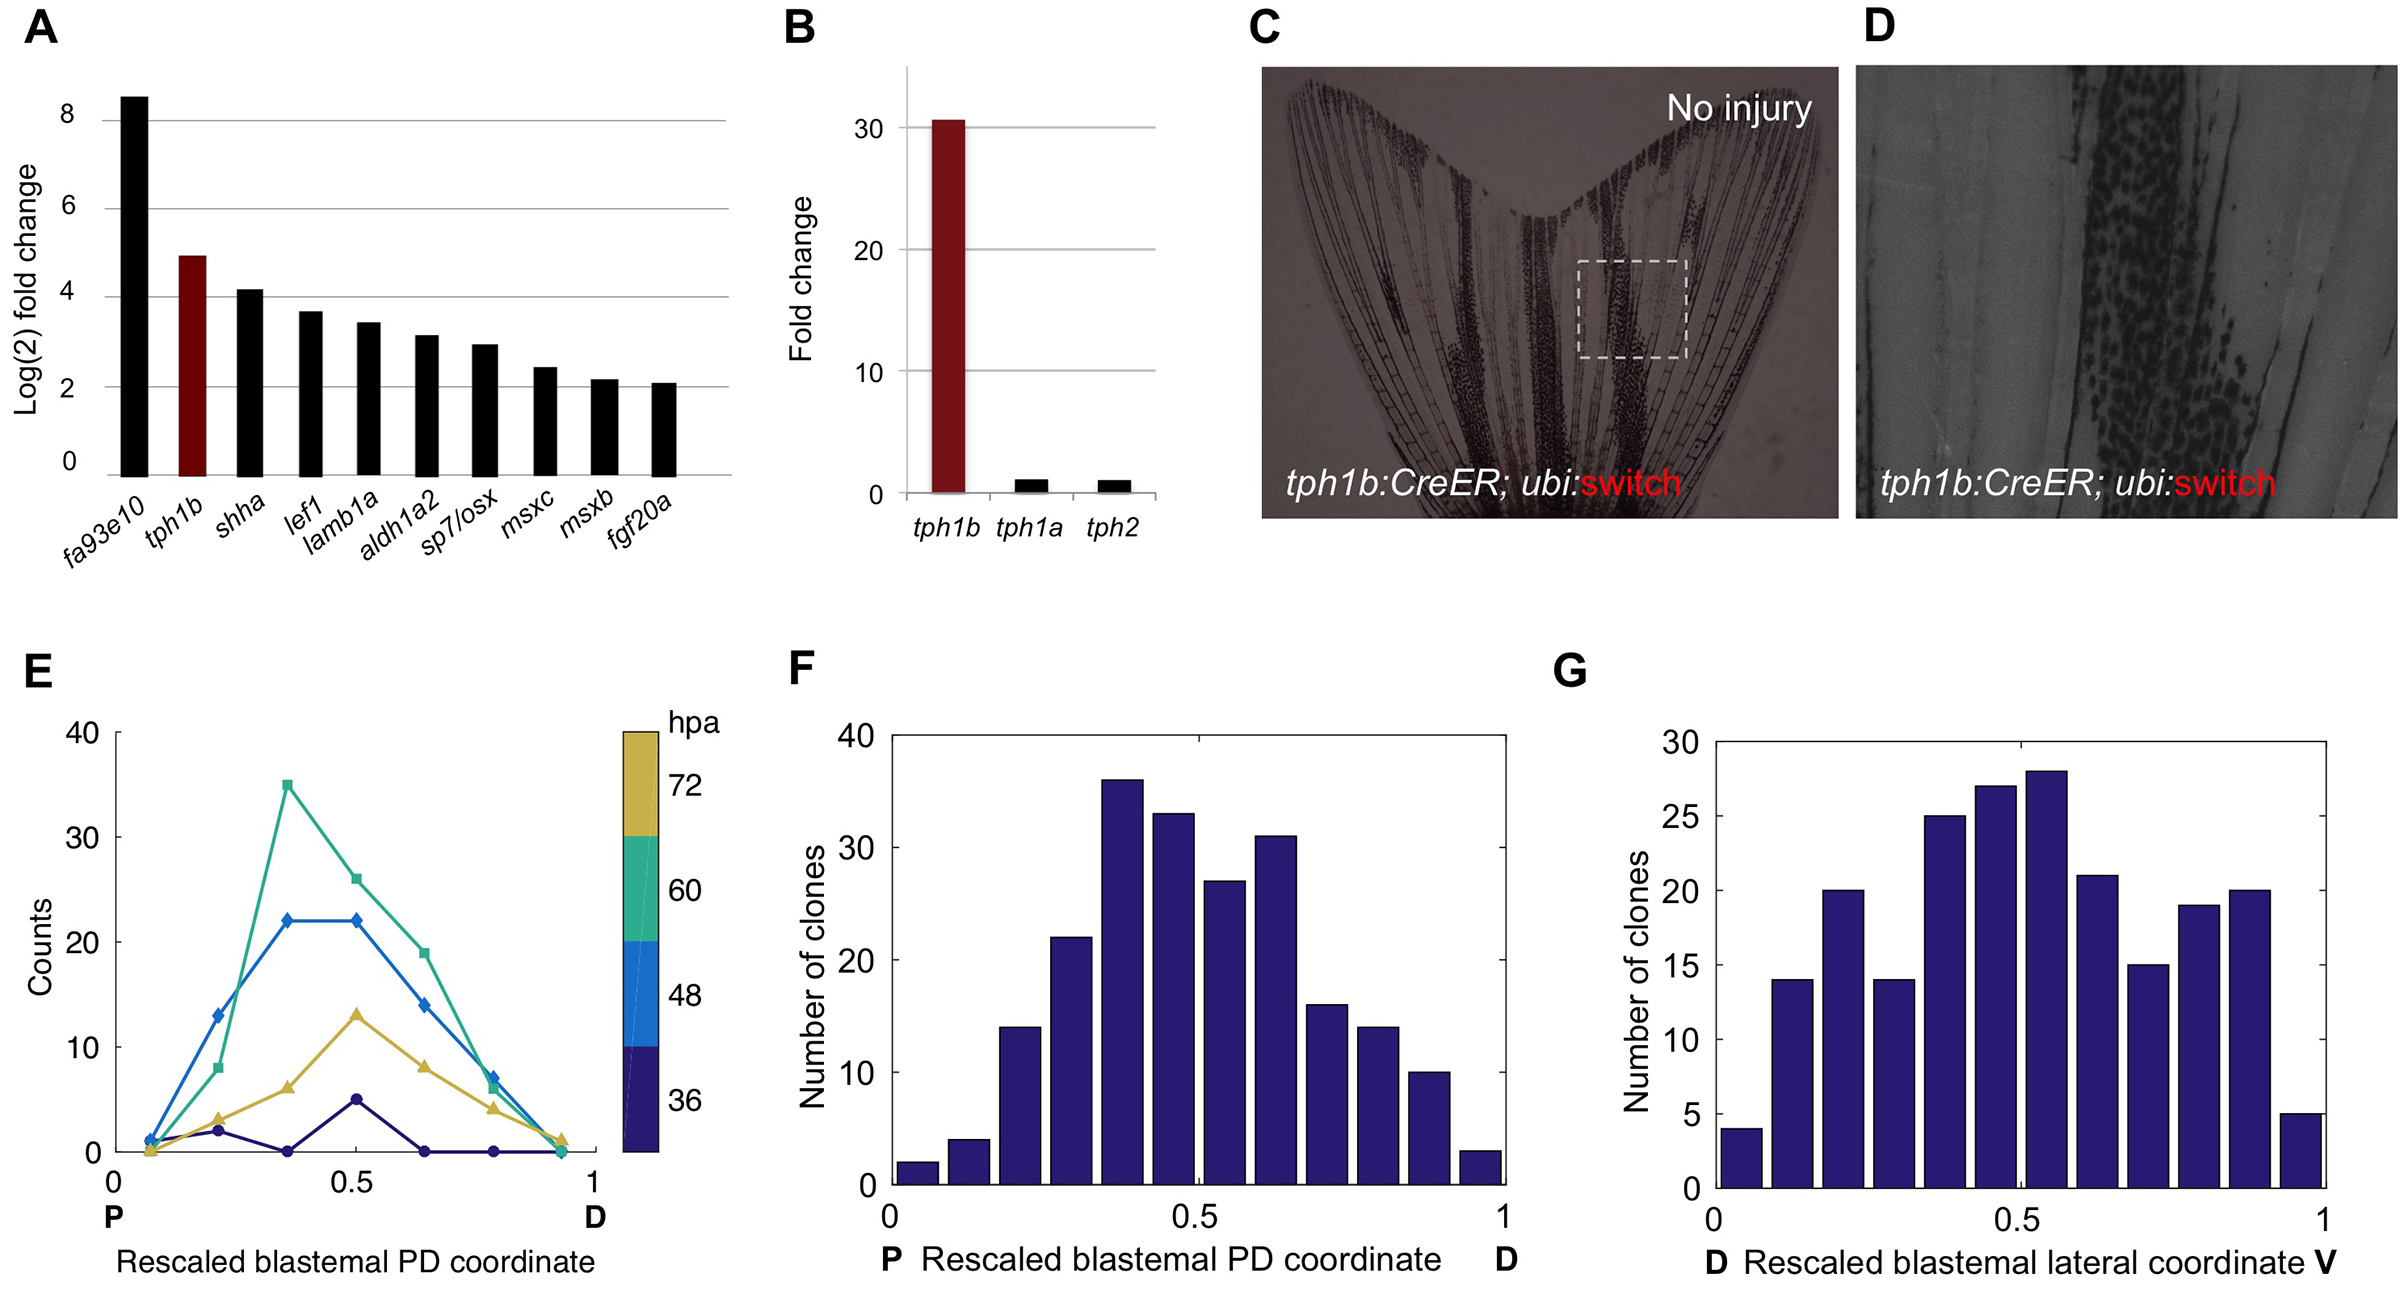
Fig. S1
Labeling Dynamics of tph1b+ Blastemal Cells, Related to Figure 1
(A) Fold-changes (log2) of transcript levels during fin regeneration at 4 days post amputation (dpa) compared to uninjured fins, from RNA-Seq analysis.
(B) Fold-changes of tph1a, tph1b, and tph2 at 4 dpa, from RNA-Seq analysis.
(C and D) tph1b:CreER; ubi:switch caudal fins show no detectable labeling without tamoxifen treatment or amputation (red channel). Image in (D) is magnified view of the box in (C).
(E) Number of spontaneous recombination events, color-coded by time of detection of initial labeling event. Labeling events between 48-72 hpa were evenly distributed across the PD axis. Labeling events detectable at 36 hpa had a medial skew.
(F) Histogram of rescaled PD positions of labeling events. A triples test for symmetry of the distribution yields P = 0.071.
(G) Histogram of rescaled dorsoventral (DV) position of labeling events. A triples test for symmetry yields P = 0.7.