
|
Fig. 1
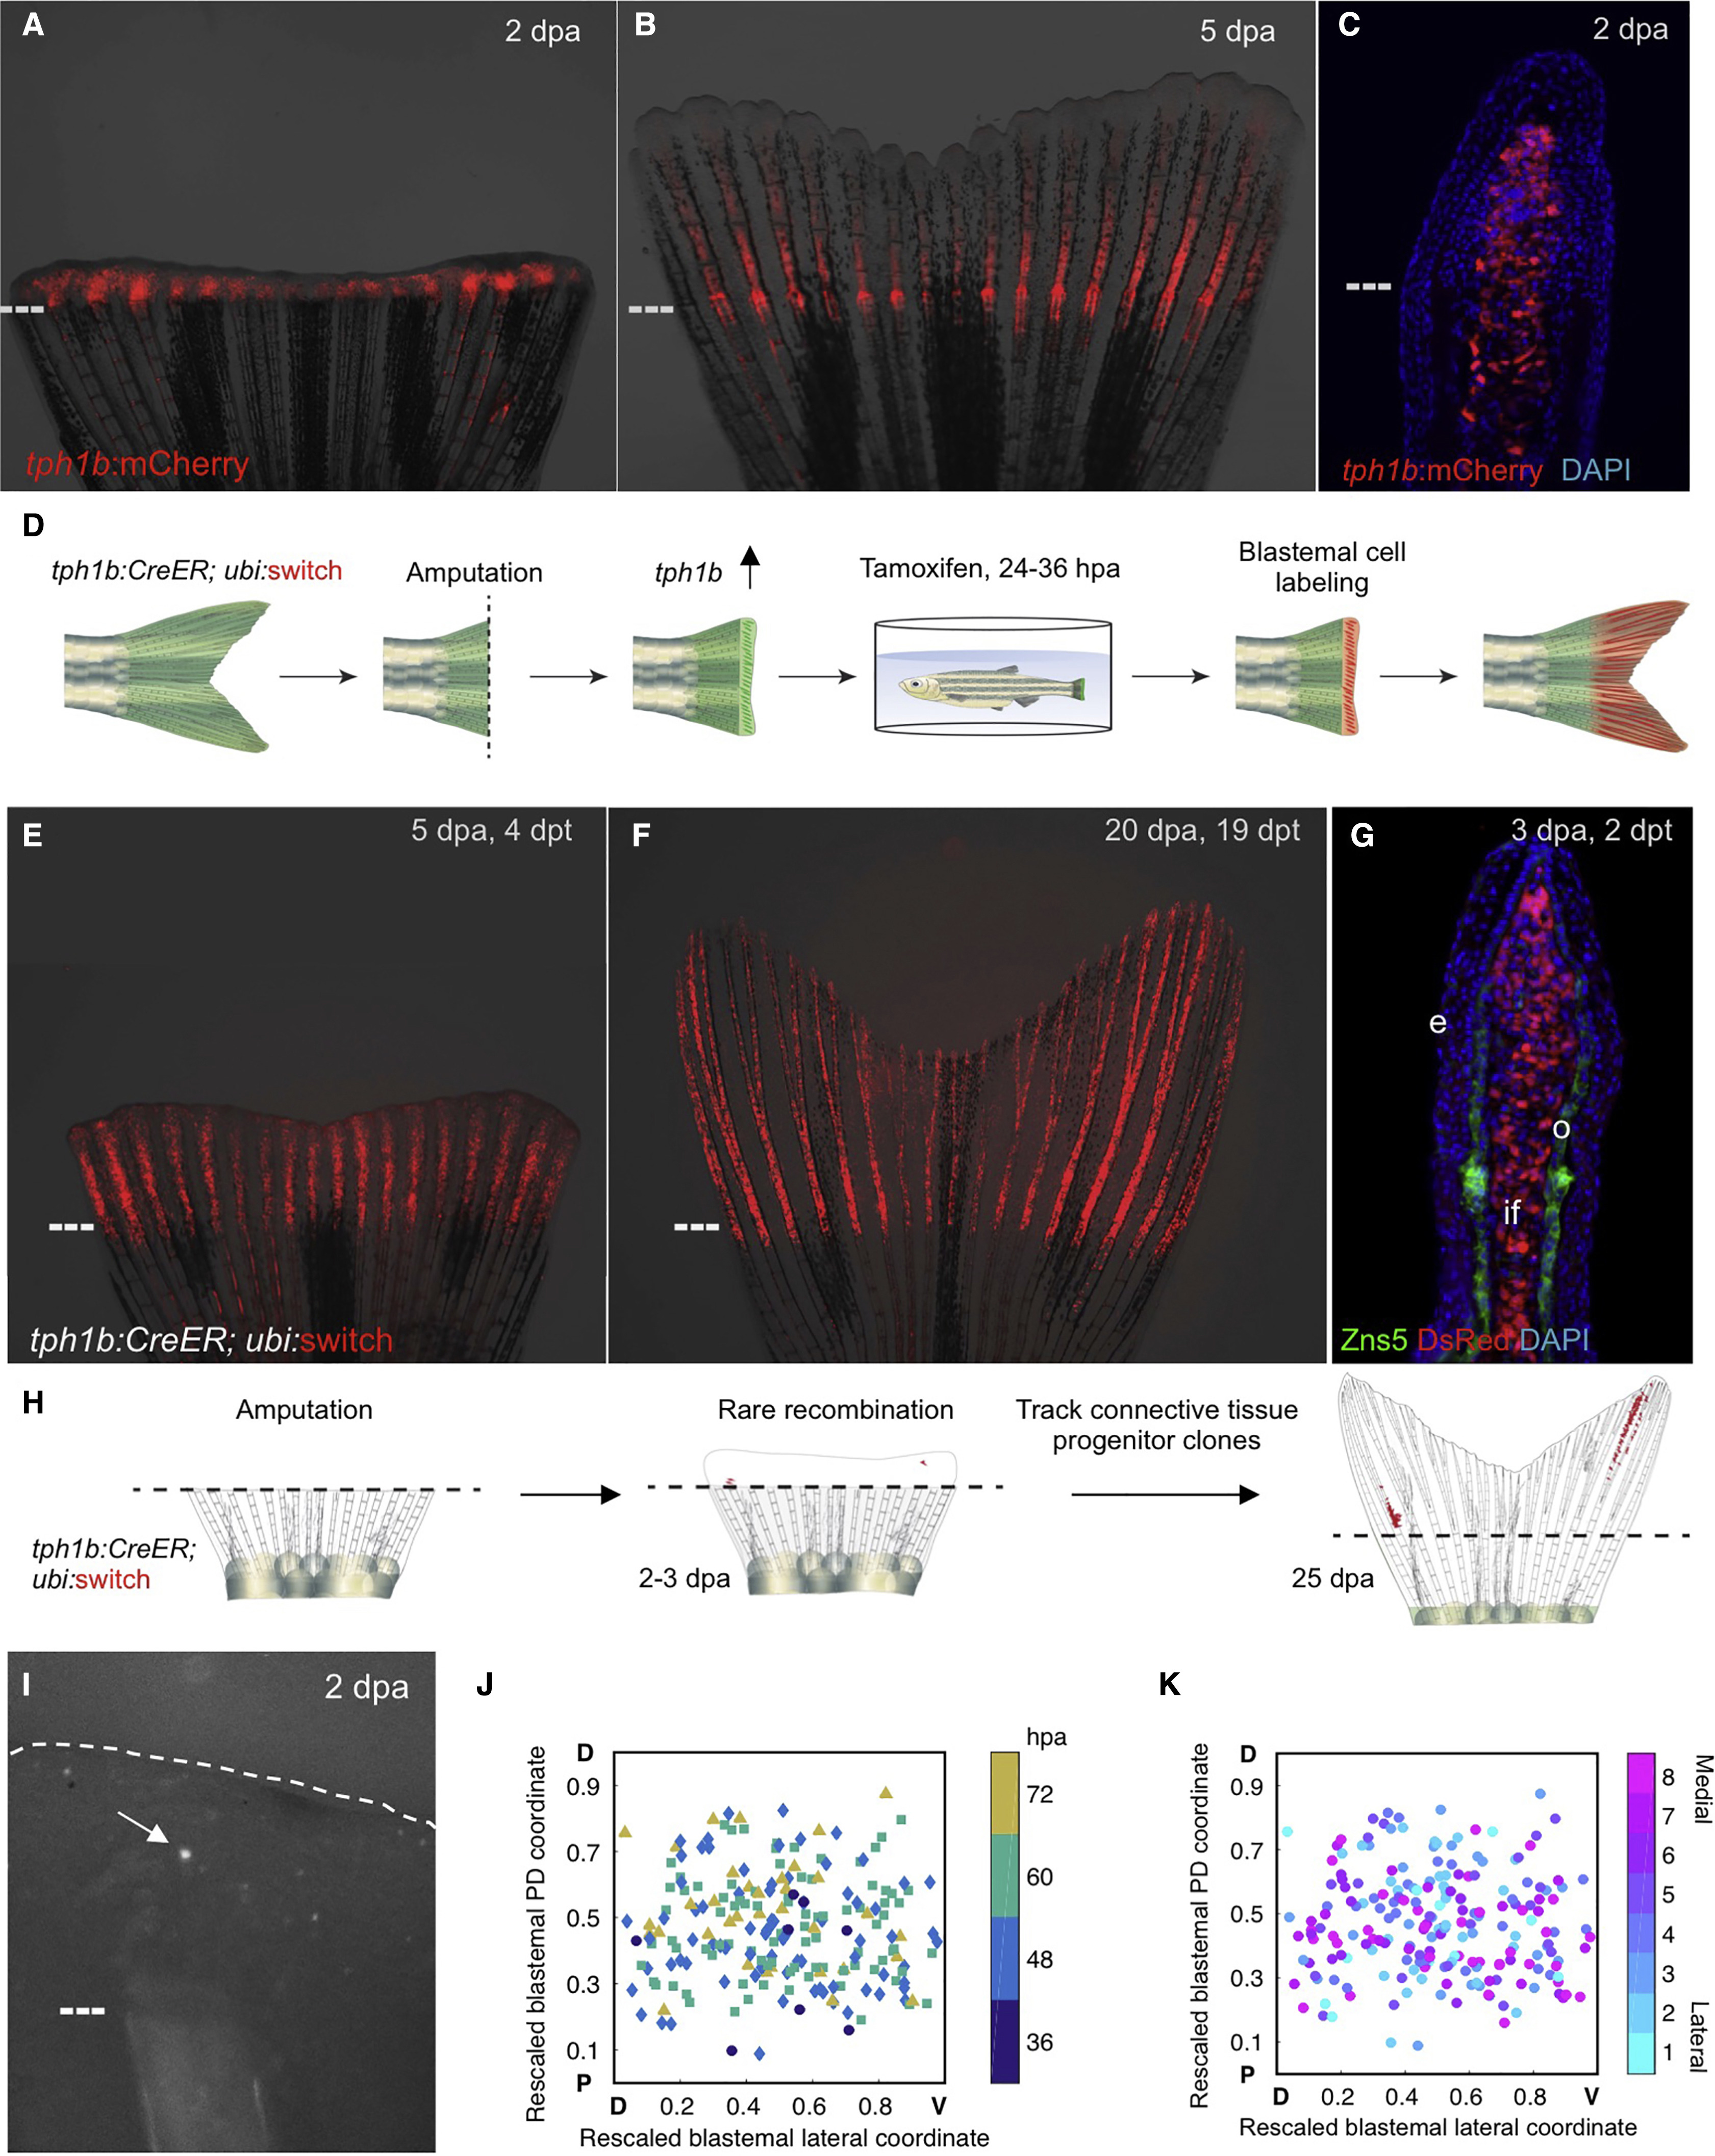
tph1b Regulatory Sequences Permit Clonal Analysis of Blastemal Cells
(A and B) tph1b:mCherry reporter expression in regenerating fins at 2 (A) and 5 (B) days post-amputation (dpa).
(C) Section of tph1b:mCherry fin at 2 dpa.
(D) Design of lineage tracing experiments in (E and F).
(E and F) tph1b:CreER; ubi:switch fins were treated with 4 μM tamoxifen from 24–36 hr post-amputation (hpa) and imaged at 5 (E) and 20 (F) dpa.
(G) Section through 3-dpa lineage-labeled tph1b:CreER; ubi:switch fin, stained for osteoblasts (green) using the Zns5 antibody as well as nuclei (DAPI, blue). e, epidermis; o, osteoblasts, if, intraray fibroblasts.
(H) Design of clonal analysis experiments in (I–K).
(I) Representative image of a single labeled blastemal cell (arrow) in a 2-dpa blastema.
(J) Two-dimensional projection of all initial labeling events onto a rescaled virtual blastema, with rescaled lateral coordinates (D, dorsal; V, ventral) and initial PD coordinates (amputation plane, P, proximal; distal tip, D, distal), color coded by time of detection of the initial labeling event.
(K) Two-dimensional projection of all initial labeling events onto a rescaled virtual blastema, color coded by ray of origin (1 indicates lateral-most ray, 8 indicates the medial ray). Dashed lines, amputation planes.
See also Figure S1.