
- Title
-
Directional migration of neural crest cells in vivo is regulated by Syndecan-4/Rac1 and non-canonical Wnt signaling/RhoA
- Authors
- Matthews, H.K., Marchant, L., Carmona-Fontaine, C., Kuriyama, S., Larraín, J., Holt, M.R., Parsons, M., and Mayor, R.
- Source
- Full text @ Development
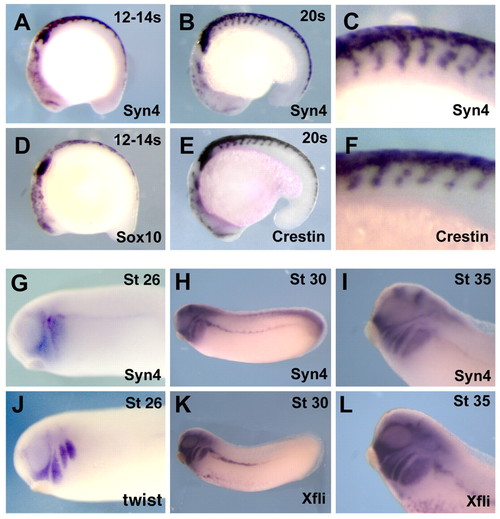
syn4 is expressed in the migrating NC. (A-L) Lateral views of zebrafish (A-F) and Xenopus (G-L) embryos. Anterior is to the left. (A,D) 12- to 14-somite embryo. (B,E) 20-somite embryo; (C,F) higher magnification of the trunk region in B,E. (A-C) syn4 expression; (D) sox10 expression; (E,F) crestin expression. Note that the expression of syn4 in the migrating NC cannot be distinguished from the expression of the NC markers. (G,J) Stage 26 embryo. (H,K) Stage 30 embryo. (I,L) Cephalic region of a stage 35 embryo. (G-I) syn4 expression. (J) twist expression. (K,L) fli expression. Note the expression of syn4 in the migrating cephalic NC. EXPRESSION / LABELING:
|
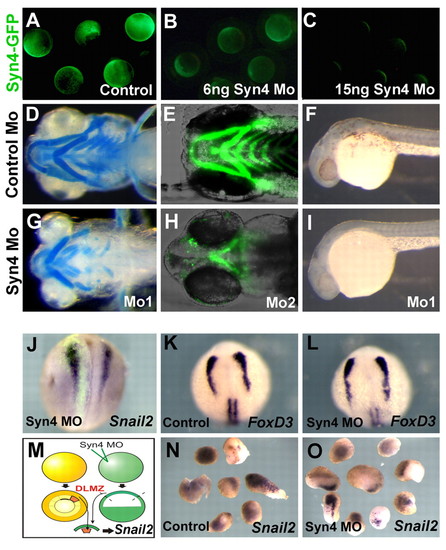
Syn4 is required for NC development but not for NC induction. (A-C) Efficiency of the syn4 MO. Zebrafish embryos were injected with 250 pg of syn4-egfp mRNA containing the MO-binding site (A). Fluorescence was significantly decreased by co-injection of 6 ng syn4 MO (B) and was totally abolished with 15 ng MO (C), demonstrating that the MO is able to efficiently inhibit Syn4. (D,E,G,H) Ventral view of zebrafish embryos showing cartilage development, analyzed by Alcian Blue staining (D,G) or cartilage fluorescence in the sox10:egfp line (E,H). (D,E) Control MO; (G) 6 ng of syn4 MO1; (H) 6 ng of syn4 MO2. (F,I) Lateral view of zebrafish embryos showing melanocytes. (F) Control MO; (I) syn4 MO. (J-O) Syn4 is not required for NC induction. (J) syn4 MO was co-injected with FDX into one blastomere of a two-cell stage Xenopus embryo and the expression of snail2 was analyzed at stage 18, before NC migration. No effect on the expression of snail2 was observed (96%, n=42). (K,L) Zebrafish embryos were injected with control MO (K) or syn4 MO (L), and the expression of the premigratory NC marker foxd3 was analyzed. No effect on the expression of foxd3 was produced by injection of syn4 MO. (M) syn4 MO was injected into one-cell stage Xenopus embryos, and at the blastula stage animal caps were dissected and conjugated with dorsolateral marginal zone (DLMZ), which is know to induce NC. The expression of snail2 was analyzed at the equivalent of stage 18. (N) Conjugates of DLMZ with control animal caps show a strong induction of snail2 (100%, n=15). (O) Conjugates of DLMZ with syn4-MO injected animal caps also show a strong induction of snail2 (100%, n=10). |
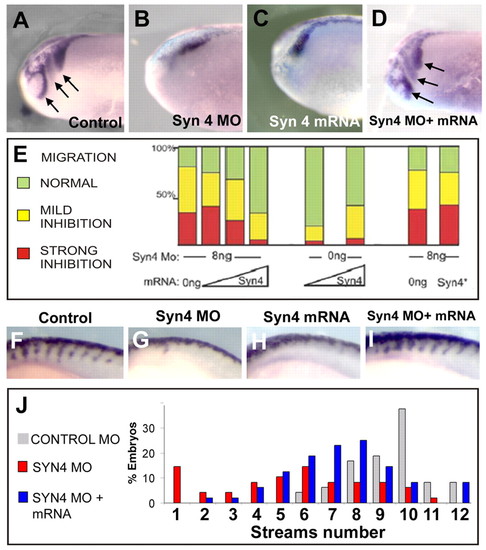
Syn4 is required for NC migration. (A-D) Lateral view of Xenopus cephalic NC at stage 24, analyzed by the expression of snail2. Arrows indicate streams of migrating NC. (A) 8 ng control MO; (B) 8 ng syn4 MO; (C) 100 pg syn4 mRNA; (D) 8 ng syn4 MO and 100 pg syn4 mRNA. (E) Xenopus embryos were injected with 8 ng of syn4 MO together with 0, 25, 50 or 100 pg of syn4 mRNA (1st to 4th bar), 50 or 100 pg of syn4 mRNA only (5th and 6th bar), or 8 ng syn4 MO with 0 or 150 pg of syn4 mRNA mutated in the PKCα-binding site (Syn4*, 7th and 8th bar). NC migration was analyzed by the expression of snail2 at stage 24, as shown in A. Embryos were scored as a normal migration, mild or strong inhibition. Co-injection of syn4 mRNA rescues the inhibition of NC migration produced by the syn4 MO (1st to 4th bar), but no rescue is observed with Syn4 mutated in the PKCα-binding site (Syn4*, 7th and 8th bar). (F-I) Lateral view of zebrafish at 20 somites. Trunk NC migration was analyzed by the expression of crestin. Dorsal to the top; anterior to the left. (F) Control MO (6 ng); (G) syn4 MO (6 ng); (H) syn4 mRNA (250 pg); (I) syn4 MO and syn4 mRNA. (J) NC migration was analyzed by the expression of crestin when the embryo had 20 somites. The number of streams of NC migrating through the somites was counted. Co-injection of syn4 mRNA rescues the reduction in the number of streams of NC produced by syn4 MO. PHENOTYPE:
|
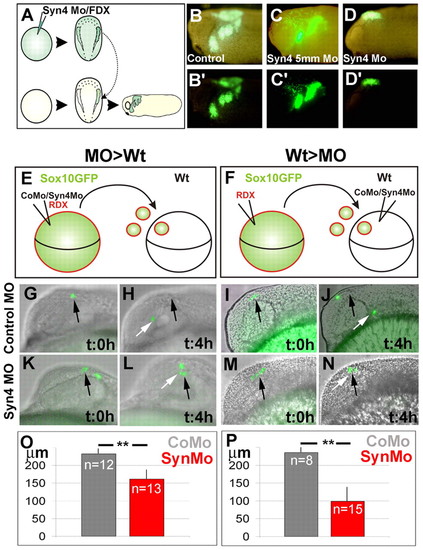
Syn4 is required for NC migration in a cell- and non-cell-autonomous manner. (A-D') Xenopus NC grafts. (A) Embryos were injected at the one-cell stage with 8 ng of syn4 MO and FDX; at stage 16, the NC were dissected, grafted into a normal host and NC migration was analyzed by looking at the fluorescence. (B,B′) Control showing normal NC migration (87% of migration, n=15). (C,C′) syn4 5-base mismatch morpholino (syn4 5mm MO)-injected embryo, showing normal NC migration (75% of migration, n=12). (D,D′) syn4 MO-injected embryo showing inhibition of NC migration (0% of migration, n=15). (E-P) Zebrafish graft embryos. (E) sox10:egfp embryos were co-injected with RDX and control or syn4 MO; cells taken from these embryos were grafted into wild-type embryos and NC migration was analyzed. (F) sox10:egfp embryos were injected with RDX; cells taken from these embryos were grafted into wild-type embryos previously injected with control or syn4 MO and NC migration was analyzed. (G-N) GFP-expressing cells were overlapped on DIC image. Black arrow indicates the initial position of the NC; white arrow indicates the position of the NC after 4 hours. (G-J) Control MO; (K-N). syn4 MO. (O) Average distance traveled for the grafted cells in 4 hours in experiment shown in E. (P) Average distance traveled for the grafted cells in 4 hours in experiment shown in F. **P<0.005. |
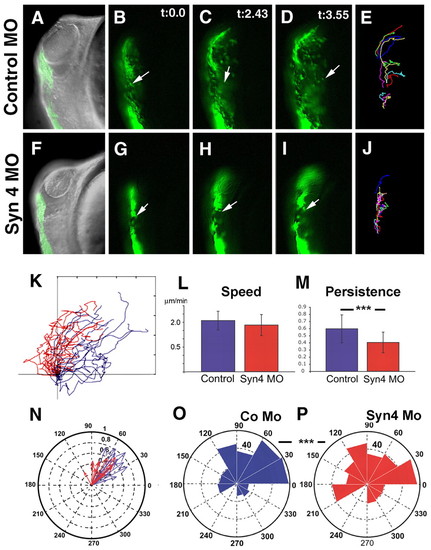
Syn4 controls the persistence of NC migration. A sox10:egfp zebrafish transgenic line was used to analyze NC migration in vivo. (A-D,F-I) Time lapse of embryos at 16 hpf carried out for 4 hours, three frames (t=0.0 min, t=2.43 min and t=3.55 min) are shown; first frame is also overlapped with a DIC image. Dorsal to the left; anterior to the top. Arrow indicates an individual cell as an example. (E,J) Trajectories of 4 hours of migration. (A-E) Control MO; (F-J) syn4 MO. (K) Trajectories of cells from different experiments. Blue, control MO; red, syn4 MO. (L) Velocity of migration. (M) Persistence of migration. (N) Angle of migration for each individual cell. Blue, control MO; red, syn4 MO. (O,P) Rose plot showing the distribution of angles of each time point during the 4 hours of migration. The area of each bin represents the number of cells moving in that direction. (O) Control MO; (P) syn4 MO. ***P<0.005. EXPRESSION / LABELING:
|
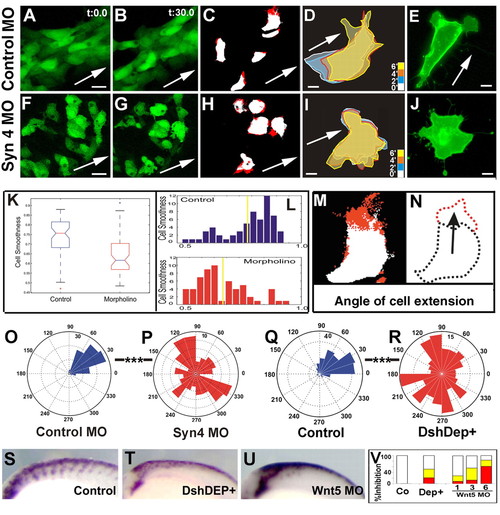
Syn4 and PCP signaling control the orientation of cell protrusions. (A,B,F,G) Time-lapse analysis of the mandibular NC stream of a sox10:egfp embryo at 18 hpf for 30 minutes. The initial and final frames are shown. Arrow indicates the expected direction of migration based on the orientation of the embryo. Cell extensions are shown in C and H in red. (D,I) Outline of individual cells at different times (minutes). (E,J) NC cells cultured in vitro, expressing membrane GFP. (A-E) Control MO; (F-J) syn4 MO. Scale bars: 25 μm in A,F; 10 μm in D,E,I,J. (K,L) Quantification of cell smoothness (CS) of NC cells. (K) Box-plot showing the distribution of CS values for control and syn4 MO-injected cells. A significant difference was observed (P<0.005). (L) Histogram of CS for control and syn4-MO injected cells. (M,N) Analysis of CE. (M) Two consecutives frames were subtracted, in a manner that the new growing area is shown in red and the unchanged area in white. A vector between the centroid of the cell and the centroid of the red area was drawn (arrow in N). (O-R) Rose plots showing the orientation of CE. (O) Control MO; (P) syn4 MO; (Q) control embryo; (R) embryo injected with DshDep+. Note the difference in scale. Scale bar: 20 μm; ***P<0.005. (S-V) Non-canonical Wnt signaling is required for zebrafish neural crest migration. Lateral views of dorsal neural tubes of 20-somite zebrafish embryos are shown after crestin staining by in situ hybridization. Dorsal to the top; anterior to the left. (S) Control; (T) 200 pg of DshDep+ mRNA; (U) 3 ng of wnt5 MO. (V) Percentage of inhibition in trunk NC migration. White, no inhibition; yellow, mild inhibition; red, strong inhibition. EXPRESSION / LABELING:
|
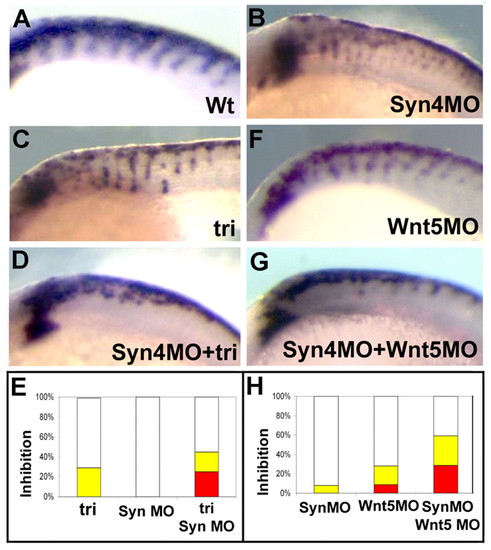
Interaction between Syn4 and PCP signaling. Zebrafish genetic interaction experiment. Lateral views of dorsal neural tubes of 20-somite zebrafish embryos are shown after crestin staining by in situ hybridization. Dorsal to the top; anterior to the left. (A) Wild-type embryo. (B) Wild-type embryo injected with 1 ng of syn4 MO. (C) tri mutant. (D) tri mutant injected with 1 ng of syn4 MO. (E) Percentage of inhibition of NC migration. White, no inhibition; yellow, mild inhibition; red, strong inhibition. (F) Wild-type embryo injected with 1 ng of wnt5 MO. (G) Wild-type embryo co-injected with 1 ng of wnt5 MO and 1 ng of syn4 MO. (H) Percentage of inhibition of trunk NC migration. EXPRESSION / LABELING:
|
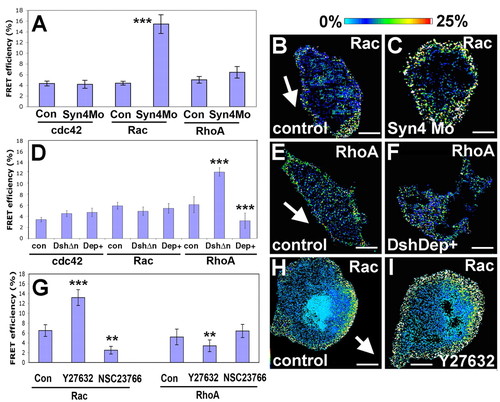
FRET analysis of Cdc42, Rac and RhoA activity in NC migrating in vitro after modification of Syn4 and PCP signaling. Embryos were injected with the probes for Cdc42, Rac and RhoA. Neural crest was dissected, cultured in vitro and FRET analysis performed. (A) FRET efficiency for Cdc42, Rac and RhoA in control or syn4 MO-injected NC cells. (B) Rac FRET efficiency for control NC. Arrow indicates the direction of migration, determined by time-lapse analysis of cell behavior immediately before fixation. (C) Rac FRET efficiency for syn4 MO NC. (D) FRET efficiency for Cdc42, Rac and RhoA in control or cells injected with 1 ng DshΔn or 1 ng DshDep+ (Dep+). (E) RhoA FRET efficiency for control NC. Arrow indicates the direction of migration. (F) RhoA FRET efficiency for DshDep+-injected NC. (G) FRET analysis for RhoA and Rac was performed after treatment with the RhoA inhibitor Y27632 or the Rac inhibitor NSC23766. (H) Rac FRET efficiency for control NC. Arrow indicates the direction of migration. (I) Rac FRET efficiency for the cell treated with Y27632. ***P<0.005; **P<0.01. Scale bar: 10 μm. |
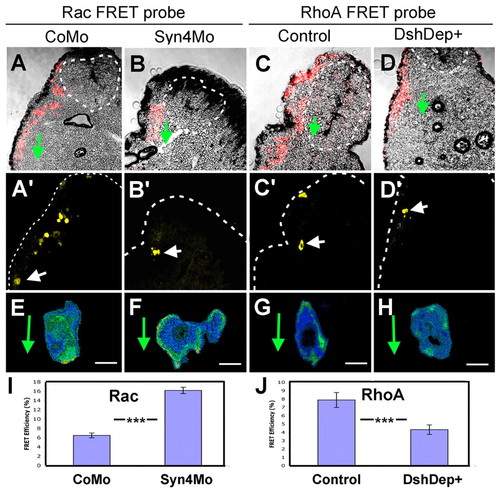
FRET analysis in vivo for Rac and RhoA after modification of Syn4 and PCP signaling. Embryos were injected with the FRET probes for Rac and RhoA and membrane-RFP. Before migration, the NCs were grafted into wild-type host embryos. NC migration was observed in vivo and then the embryos were fixed, sectioned and processed for FRET analysis. (A-D) Overlay of membrane-RFP and bright-field images. Dotted circle indicates the neural tube; arrow, direction of migration. (A′-D′) Fluorescence from the FRET probes. Arrow indicates the selected cells shown in E-H. (E-H) Examples of FRET efficiency. Arrow indicates the direction of migration. (A,A′,E) Rac probe in cells injected with control MO. (B,B′,F) Rac probe in cells injected with syn4 MO. (C,C′,G) RhoA probe in cells injected with control MO. (D,D′,H) RhoA probe in cells injected with DshDep+. (I) FRET efficiency for Rac. (J) FRET efficiency for RhoA. ***P<0.005. Scale bar: 10 μm. |
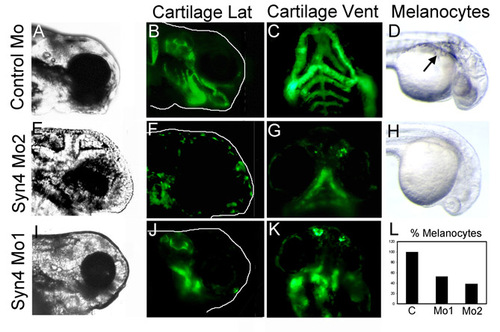
Syn4 is required for the development of NC derivatives. (A-K) Lateral (A,B,D,E,F,H,I,J) and ventral (C,G,K) views of zebrafish embryos showing the expression of GFP in the cartilage of the transgenic line sox10:egfp (B,C,F,G,J,K) and the development of melanocytes (D,H,L). (A-D) Embryos injected with control MO. (E-H) Embryos injected with 6 ng of syn4 MO2. (I-K) Embryos injected with 6 ng of syn4 MO1. Note that both syn4 MOs produced an equivalent inhibition in cartilage development (45% inhibition for MO2, n=60; 52% inhibition for MO1, n=104). (D,H,L) syn4 MO2 produced a clear inhibition in melanocyte development, similar to the one produced by syn4 MO1 (see Fig. 2F,I). |
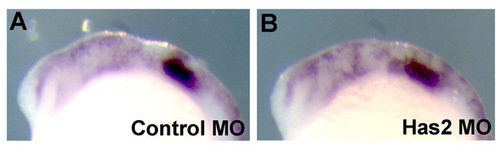
Inhibition of convergent extension by Has2 MO does not inhibit NC migration. (A) sox10 expression in embryo injected with control MO. (B) sox10 expression in embryo injected with 1 nl of 0.25 mM Has2 MO. No effect on NC migration is observed. |
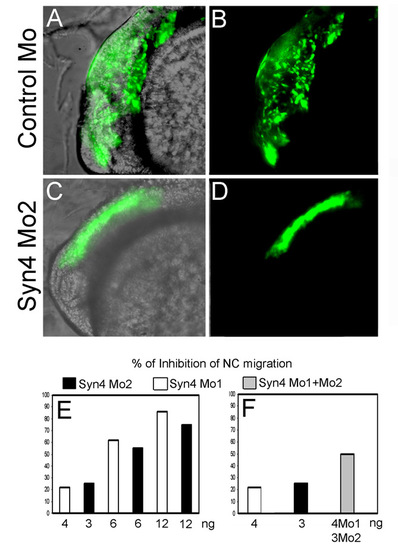
Syn4 is required for NC migration. Migration of NC was examined in vivo using the transgenic zebrafish line sox10:egfp. (A,B) Embryo injected with control MO, showing normal migration of cephalic NC at 24 hpf. (C,D) Embryo injected with syn4 MO2 showing inhibition of NC migration at 24 hpf. The inhibition of NC migration is similar to that produced by syn4 MO1 (see Fig. 5F-J). (E) Dose-dependent effect of syn4 MO1 or MO2 on neural crest migration. (F) The mix of syn4 MO1 + syn4 MO2 has an additive effect on NC migration compared with injection of each single morpholino (n=79). EXPRESSION / LABELING:
|