
|
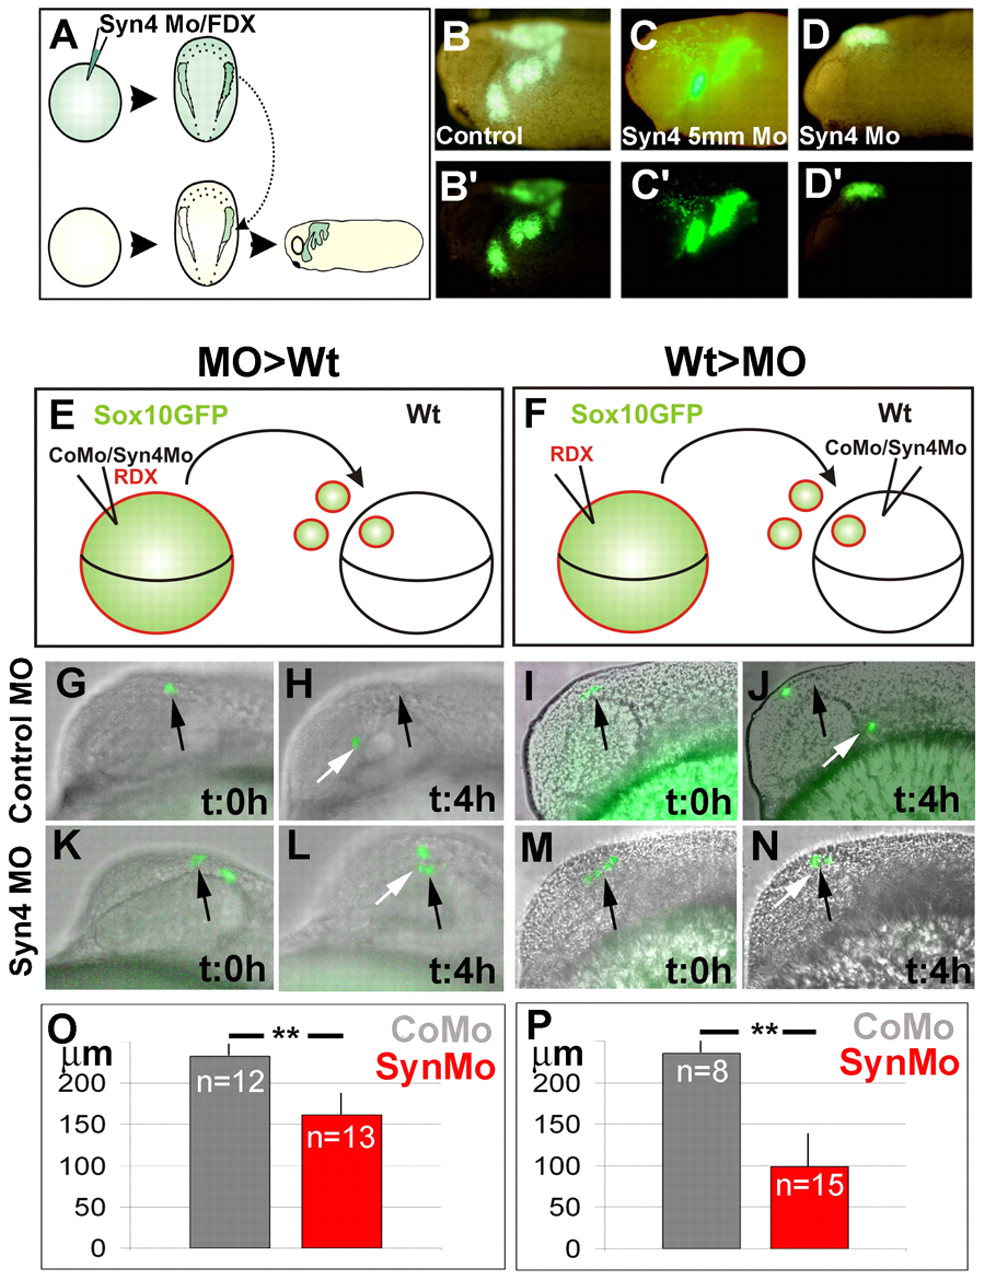
Fig. 4 Syn4 is required for NC migration in a cell- and non-cell-autonomous manner. (A-D') Xenopus NC grafts. (A) Embryos were injected at the one-cell stage with 8 ng of syn4 MO and FDX; at stage 16, the NC were dissected, grafted into a normal host and NC migration was analyzed by looking at the fluorescence. (B,B′) Control showing normal NC migration (87% of migration, n=15). (C,C′) syn4 5-base mismatch morpholino (syn4 5mm MO)-injected embryo, showing normal NC migration (75% of migration, n=12). (D,D′) syn4 MO-injected embryo showing inhibition of NC migration (0% of migration, n=15). (E-P) Zebrafish graft embryos. (E) sox10:egfp embryos were co-injected with RDX and control or syn4 MO; cells taken from these embryos were grafted into wild-type embryos and NC migration was analyzed. (F) sox10:egfp embryos were injected with RDX; cells taken from these embryos were grafted into wild-type embryos previously injected with control or syn4 MO and NC migration was analyzed. (G-N) GFP-expressing cells were overlapped on DIC image. Black arrow indicates the initial position of the NC; white arrow indicates the position of the NC after 4 hours. (G-J) Control MO; (K-N). syn4 MO. (O) Average distance traveled for the grafted cells in 4 hours in experiment shown in E. (P) Average distance traveled for the grafted cells in 4 hours in experiment shown in F. **P<0.005.