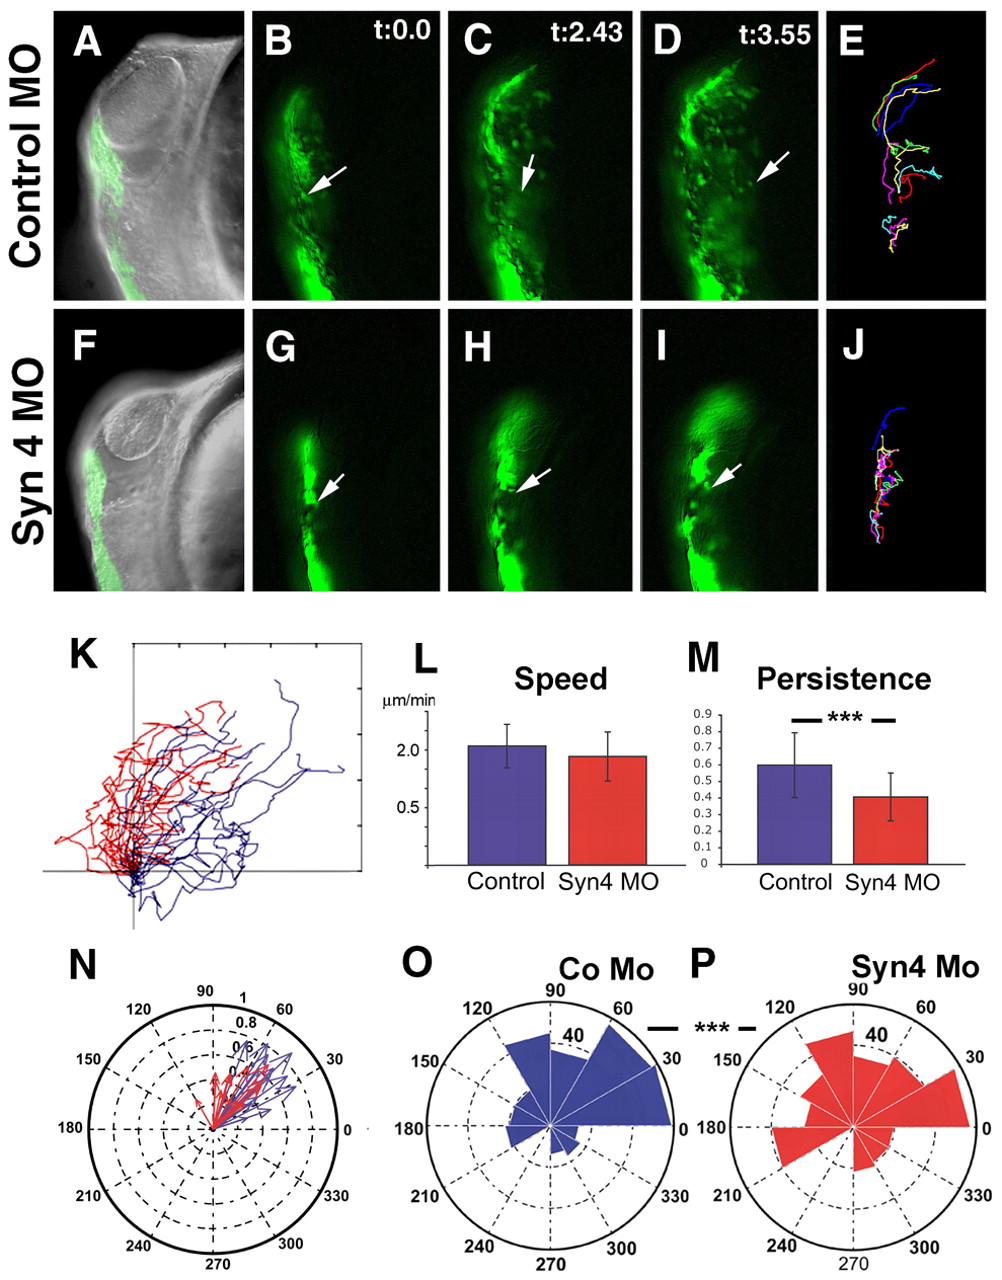
Fig. 5 Syn4 controls the persistence of NC migration. A sox10:egfp zebrafish transgenic line was used to analyze NC migration in vivo. (A-D,F-I) Time lapse of embryos at 16 hpf carried out for 4 hours, three frames (t=0.0 min, t=2.43 min and t=3.55 min) are shown; first frame is also overlapped with a DIC image. Dorsal to the left; anterior to the top. Arrow indicates an individual cell as an example. (E,J) Trajectories of 4 hours of migration. (A-E) Control MO; (F-J) syn4 MO. (K) Trajectories of cells from different experiments. Blue, control MO; red, syn4 MO. (L) Velocity of migration. (M) Persistence of migration. (N) Angle of migration for each individual cell. Blue, control MO; red, syn4 MO. (O,P) Rose plot showing the distribution of angles of each time point during the 4 hours of migration. The area of each bin represents the number of cells moving in that direction. (O) Control MO; (P) syn4 MO. ***P<0.005.
Image
Figure Caption
Figure Data
Acknowledgments
This image is the copyrighted work of the attributed author or publisher, and
ZFIN has permission only to display this image to its users.
Additional permissions should be obtained from the applicable author or publisher of the image.
Full text @ Development

