
|
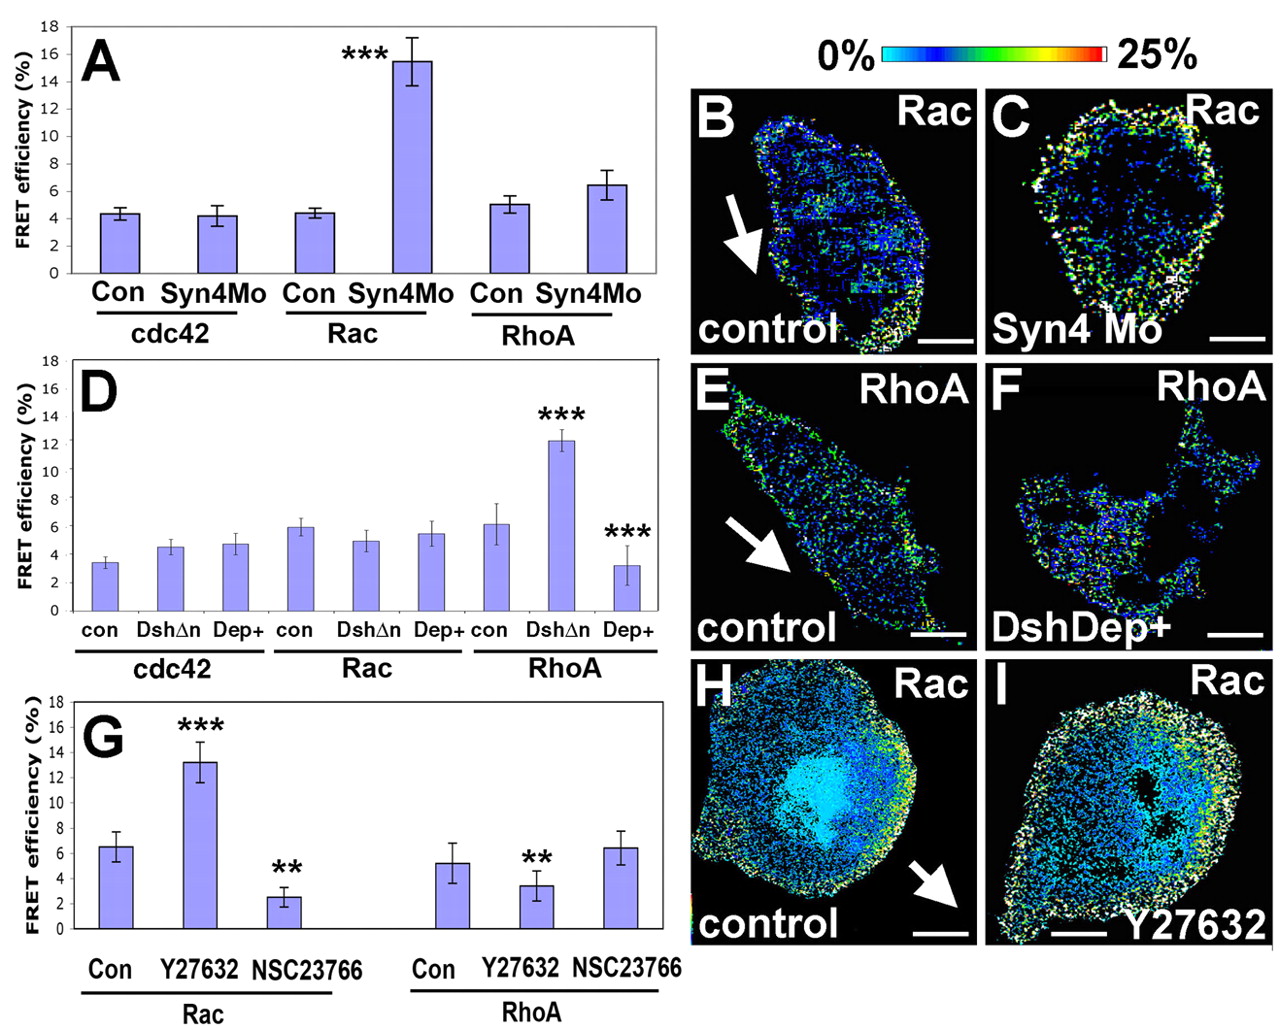
Fig. 8 FRET analysis of Cdc42, Rac and RhoA activity in NC migrating in vitro after modification of Syn4 and PCP signaling. Embryos were injected with the probes for Cdc42, Rac and RhoA. Neural crest was dissected, cultured in vitro and FRET analysis performed. (A) FRET efficiency for Cdc42, Rac and RhoA in control or syn4 MO-injected NC cells. (B) Rac FRET efficiency for control NC. Arrow indicates the direction of migration, determined by time-lapse analysis of cell behavior immediately before fixation. (C) Rac FRET efficiency for syn4 MO NC. (D) FRET efficiency for Cdc42, Rac and RhoA in control or cells injected with 1 ng DshΔn or 1 ng DshDep+ (Dep+). (E) RhoA FRET efficiency for control NC. Arrow indicates the direction of migration. (F) RhoA FRET efficiency for DshDep+-injected NC. (G) FRET analysis for RhoA and Rac was performed after treatment with the RhoA inhibitor Y27632 or the Rac inhibitor NSC23766. (H) Rac FRET efficiency for control NC. Arrow indicates the direction of migration. (I) Rac FRET efficiency for the cell treated with Y27632. ***P<0.005; **P<0.01. Scale bar: 10 μm.