
|
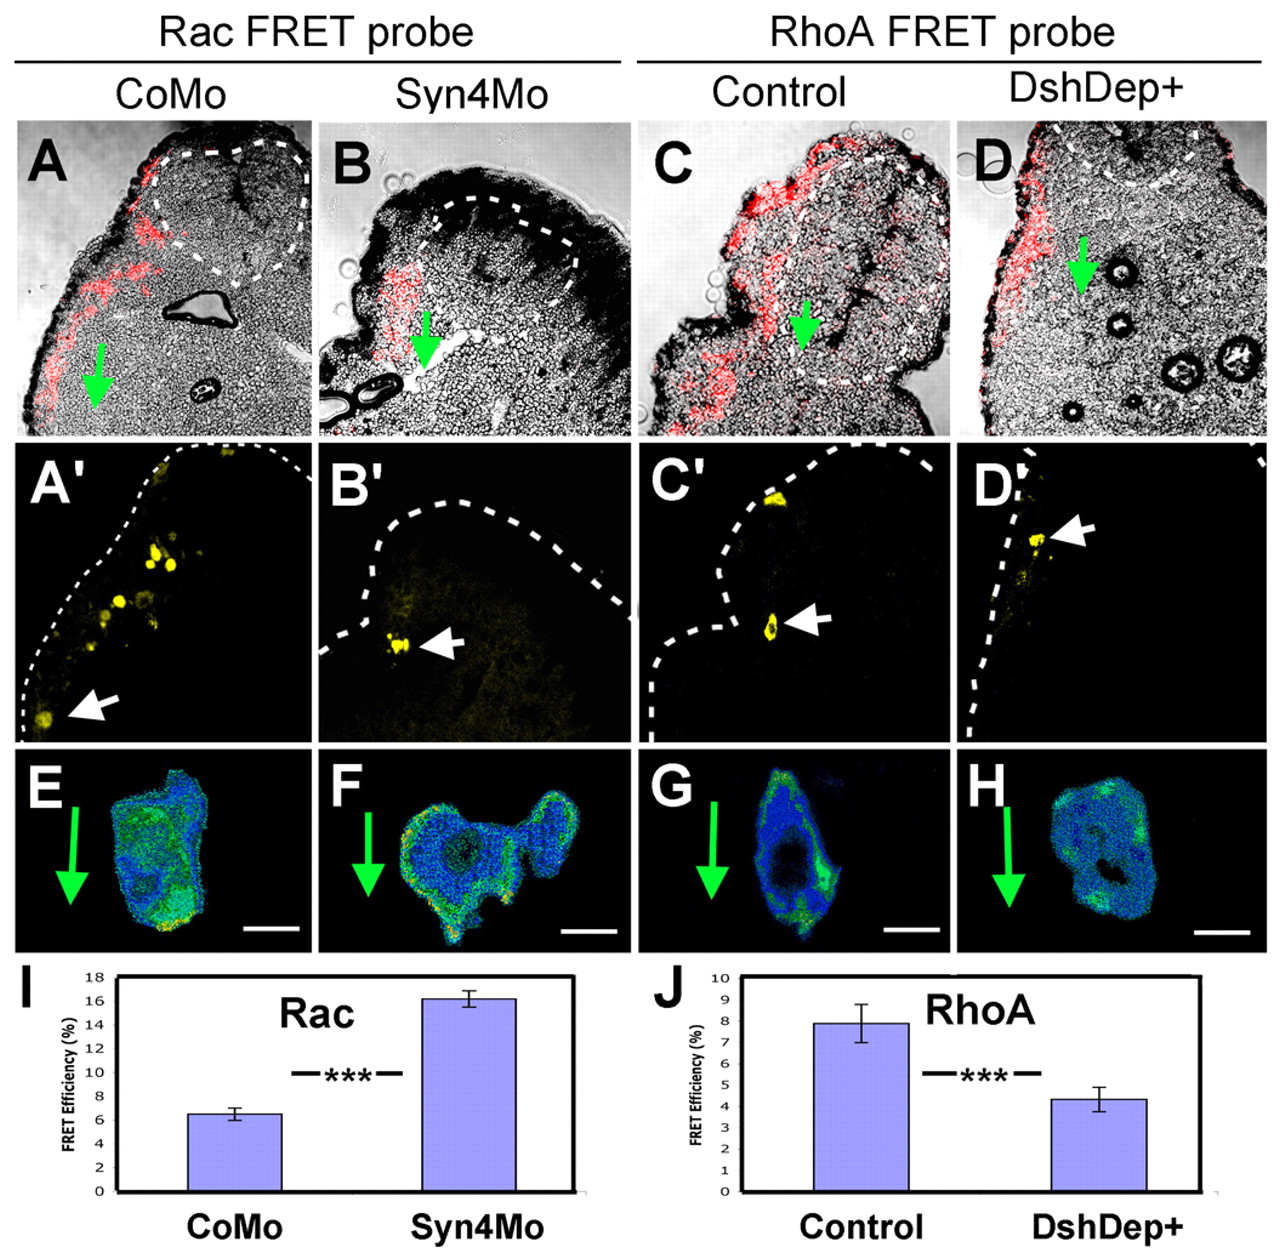
Fig. 9 FRET analysis in vivo for Rac and RhoA after modification of Syn4 and PCP signaling. Embryos were injected with the FRET probes for Rac and RhoA and membrane-RFP. Before migration, the NCs were grafted into wild-type host embryos. NC migration was observed in vivo and then the embryos were fixed, sectioned and processed for FRET analysis. (A-D) Overlay of membrane-RFP and bright-field images. Dotted circle indicates the neural tube; arrow, direction of migration. (A′-D′) Fluorescence from the FRET probes. Arrow indicates the selected cells shown in E-H. (E-H) Examples of FRET efficiency. Arrow indicates the direction of migration. (A,A′,E) Rac probe in cells injected with control MO. (B,B′,F) Rac probe in cells injected with syn4 MO. (C,C′,G) RhoA probe in cells injected with control MO. (D,D′,H) RhoA probe in cells injected with DshDep+. (I) FRET efficiency for Rac. (J) FRET efficiency for RhoA. ***P<0.005. Scale bar: 10 μm.