
- Title
-
The zebrafish cerebellar rhombic lip is spatially patterned in producing granule cell populations of different functional compartments
- Authors
- Volkmann, K., Rieger, S., Babaryka, A., and Köster, R.W.
- Source
- Full text @ Dev. Biol.
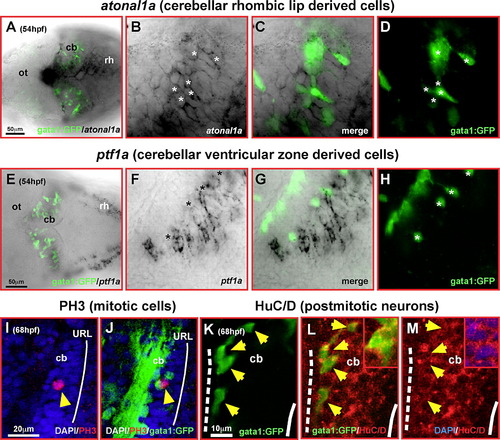
Differentiating GFP-expressing cells in the cerebellum of transgenic gata1:GFP embryos are derived from the rhombic lip. Dorsal views of cerebella (A, E) or single optical section taken by confocal microscopy of one magnified cerebellar half (B–D, F–H) analyzed by immunohistochemistry against GFP-expression and mRNA in situ hybridization for zebrafish atonal1a (A–D) or ptf1a-expression (E–H), respectively. Whereas GFP-expressing cells (D, H, white asterisk) are co-expressing atonal1a (B), they are spared by ptf1a-expression and are positioned in gaps of the ptf1a-expression pattern (F). (I–M) Single optical section of the lateral view of the cerebellum recorded by confocal microscopy at 68 hpf. Although only few GFP-expressing cells (I, J, yellow arrowhead) co-express the mitotic M-phase marker PH3 close to the upper rhombic lip (white solid line), most GFP-expressing neuronal precursors (K–M, yellow arrowheads) co-express the neuronal postmitotic marker HuC/D (L, see also inset) close to the MHB (white dashed line; note that GFP is localized throughout th28white solid line), most GFP-expressing neuronal precursors (K–M, yellow arrowheads) co-express the neuronal postmitotic marker HuC/D e cell, while HuC is confined to the cytoplasm as shown by the DAPI nuclear counterstain in the inset of panel M). Abbr.: cb, cerebellum; MHB, midbrain–hindbrain boundary; ot, optic tectum; rh, rhombencephalon; URL, upper rhombic lip. |
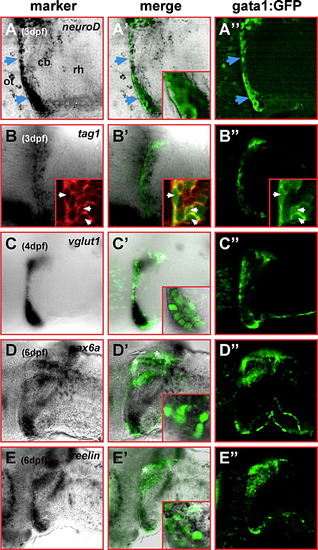
Cerebellar gata1:GFP cells show a granule cell expression profile. Single optical sections of lateral views of cerebella at 3 dpf (A–A″, B–B″), 4 dpf (C–C″) and dorsolateral views at 6 dpf (D–D″, E–E″), respectively, recorded by laser scanning confocal microscopy. In the left column, the cerebellar expression pattern of (A) neuroD, (B) tag1, (C) vglut1, (D) pax6a and (E) reelin is displayed. In the right column, cerebellar GFP-expression of the same optical section is displayed, while the overlap of both expression patterns is shown in the column in the middle with insets demonstrating the co-expression of GFP and the respective marker gene. Insets in panels B–B″ display Tag-1 expression detected by immunohistochemistry (B) co-localizing to GFP-expressing gata1:GFP cells (B′, B″ white arrowheads). GFP-expression in the dorsal-most cerebellum (white asterisks) is confined to parallel fibers (see Fig. 6), and thus, shows no co-localization with the analyzed marker gene expression. Abbr.: cb, cerebellum; ot, optic tectum; rh, rhombencephalon. EXPRESSION / LABELING:
|
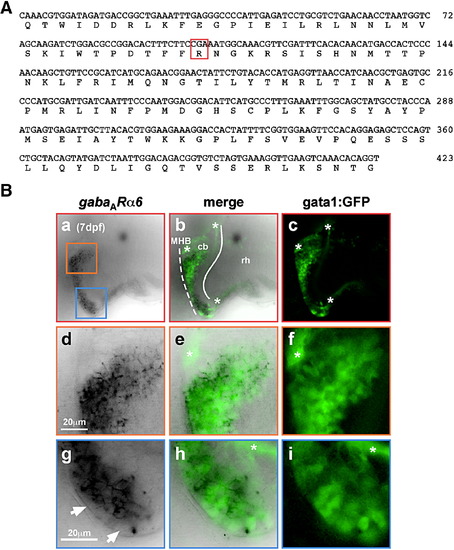
gata1:GFP cells in the cerebellum are granule neurons. (A) Nucleotide and deduced amino acid sequence of isolated zebrafish gabaARα6-cDNA fragment. The characteristic subunit-specific Arginine-residue conserved throughout vertebrates is demarcated by a red box. (B) mRNA in situ hybridization to analyze gabaARα6-expression in zebrafish larvae at 7 dpf. In single optical sections recorded by confocal microscopy, 7 dpf larvae of the gata1:GFP strain display a close overlap of gabaARα6- and GFP-expression in the cerebellum [a-c, dorsolateral view to simultaneously show GFP-expressing cells in the dorsal (orange box) and the ventrolateral (blue box) cerebellum, respectively]. Magnifications of the developing dorsal cerebellum (d-f) and the ventrolateral cerebellum (g-i) demonstrate an almost complete overlap of gabaARα6- and GFP-expression. Few GFP-positive cells along the MHB (g, white arrowhead), which do not co-express gabaARα6-mRNA, may represent not yet terminally differentiated granule cells arriving after migration along the MHB. GFP-expression in zebrafish granule cells is also confined to parallel fibers (marked by white asterisk in panels b, c, e, f, h, i; see also Fig. 6), and thus, shows no co-localization with gabaARα6-mRNA expression. Abbr.: cb, cerebellum; MHB, midbrain-hindbrain boundary; rh, rhombencephalon. EXPRESSION / LABELING:
|
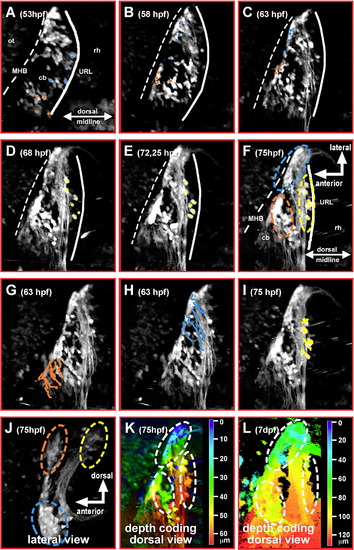
Tracing of migrating GFP-expressing granule precursor cells in gata1:GFP transgenic embryos reveals a spatial pattern of the cerebellar rhombic lip. (A–F) Dorsal view of one cerebellar half; maximum brightness projections from individual time-points of a time-lapse microscopy study of a transgenic gata1:GFP embryo are shown. Manually traced granule precursor cells contributing to the dorsomedial cluster have been marked by an orange dot, cells contributing to the ventrolateral cluster are marked by a blue dot (A–C). A smaller stationary population of GFP-expressing granule precursor cells (yellow dots) remains at the dorsoposterior edge of the differentiating cerebellum (D–F). (G–I) Independently, migratory routes were visualized by ImageJ supported cell tracing. Routes have been overlaid onto pictures of individual time-points (G, H, 63 hpf; I, 75 hpf) at which tracing has been finished. (J) Lateral view of the cerebellum, maximum intensity projection (stack of 21 images each 3 μm apart) showing that the medial and lateral granule cell clusters marked in dorsal view projections (F) are positioned apart from one another along the dorsoventrrebellum, maximum intensity projection (stack of 21 images each 3 μm apart) showing that the medial and lateral granule cell clal axis of the cerebellum. While granule precursor cells migrating towards the medial cluster (orange) remain in dorsal positions, migration of granule precursors cells heading towards the lateral cluster involves a strong ventral component. Depth coding of granule cell positions indicates that the medial and lateral granule cell clusters are about 30 to 50 μm apart along the dorsoventral axis of the cerebellum at 3 dpf (K), increasing to values of 50 to 100 μm at 7 dpf (L) due to continued growth of the cerebellum. Abbr.: cb, cerebellum; MHB, midbrain–hindbrain boundary; ot, optic tectum; rh, rhombencephalon; URL, upper rhombic lip. |
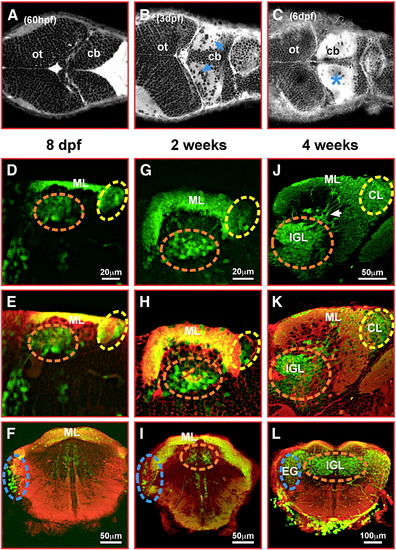
gata1:GFP granule cells contribute to the corpus cerebelli, the eminentia granularis and the cerebellar caudal lobe. (A–C) Dorsal views of the embryonic and larval zebrafish cerebellum stained with Bodipy FL C5-ceramide. Staining of cellular membranes, intense in neuropil (blue arrows and asterisk), was recorded by optical sectioning using laser scanning microscopy. (D, E, G, H, J, K) sagittal sections and (F, I, L) transverse sections through the cerebellum of 8 dpf (D–F), 2 weeks (G–I) and 4 weeks (J–L) old gata1:GFP larval and juvenile fish. GFP-expression (D, G, J) was visualized by immunohistochemistry followed by red fluorescent counterstaining with Bodipy 630/650-X (E, F, H, I, K, L) and image recording using laser scanning confocal microscopy. A dashed circle marks the forming IGL of the corpus cerebelli (orange), the eminentia granularis (blue) and the caudal lobe (yellow), respectively. Note GFP-expressing granule cells still appearing to migrate into the IGL of the corpus cerebelli at 4 weeks (J, white arrow). Abbr.: cb, cerebellum; CL, caudal lobe; EG, eminentia granularis; IGL, internal granule cell layer; ML, molecular layer; ot, optic tectum. EXPRESSION / LABELING:
|
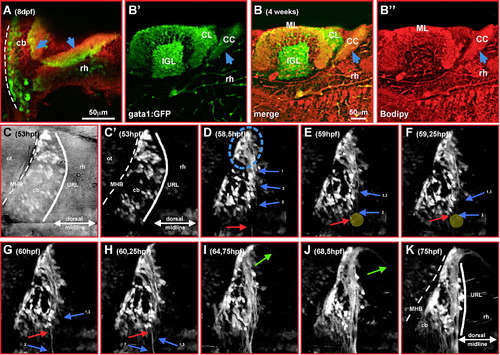
gata1:GFP granule cells project commissural axons into the crista cerebellaris. (A) Optical section of the cerebellum of 8 dpf gata1:GFP transgenic larvae. Note the dorsoposterior projection out of the cerebellum (blue arrow). Sagittal sectioning of 4-week-old gata1:GFP cerebella, immunohistochemistry against GFP-expression (B′) and counterstaining with Bodipy 630/650-X (B″) reveal positioning of these projections within the crista cerebellaris (B–B″, blue arrow). (C–K) 3-D time-lapse analysis (dorsal view) to characterize axonal projections into the crista cerebellaris (60 μm stacks of 21 individual images spaced 3 μm were recorded every 12 min). Brightest point projections of images of individual time-points are displayed. Individual axons are marked with arrows; note the contact and avoidance of growing axons from opposite cerebellar halves close to the dorsal midline (E, F, yellow circle; see slow motion sequence at the end of Movie 1). Around 65 hpf first projections into the forming crista cerebellaris can be observed (see green arrows in Movie 1 in supplementary material). Abbr.: cb, cerebellum; CC, crista cerebellaris; CL, caudal lobe; IGL, internal granule cell layer; MHB, midbrain–hindbrain boundary; ML, molecular layer; ot, optic tectum; rh, rhombencephalon; URL, upper rhombic lip. EXPRESSION / LABELING:
|
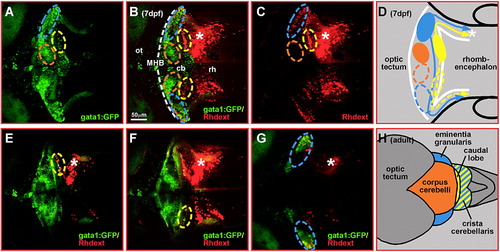
Rhodamine-dextran retrograde labeling of crista cerebellaris projections discriminates between granule cells of the vestibulo- and non-vestibulocerebellar system. Rhodamine-dextran was microinjected into one half of the GFP-fluorescent crista cerebellaris (white asterisk) in transgenic gata1:GFP embryos at 6 dpf. (A–C) Maximum intensity projections of 3-D image stack (148 μm, 75 images at 2 μm distance) recorded by laser scanning confocal microscopy at 7 dpf reveal many rhodamine-dextran labeled cells in areas of the ventrolateral (blue dashed circle) and dorsoposterior (yellow dashed circle) gata1:GFP granule cell clusters. (E–G) Single optical sections indeed revealed co-labeling of GFP-cells with rhodamine-dextran in these granule cell populations. In contrast, rhodamine-dextran labeled cells were never found in the area or to co-localize with cells of the dorsomedial granule cell cluster (orange dashed circle). (D, H) Schematic drawing of granule cell projections deduced from rhodamine-dextran retrograde labeling; note that granule cells of the dorsomedial cluster (marked orange) do not project into the crista. These studies identify the embryonic ventrolateral (D, blue dashed circle) and dorsoposterior (D, yellow dashed circle) gata1:GFP granule cell clusters as granule cells of the adult vestibulocerebellar system in zebrafish (H, schematic drawing of dorsal view) formed by the eminentia granularis (blue) and the caudal lobe (yellow), respectively. Abbr.: cb, cerebellum; MHB, midbrain–hindbrain boundary; ot, optic tectum; rh, rhombencephalon. EXPRESSION / LABELING:
|
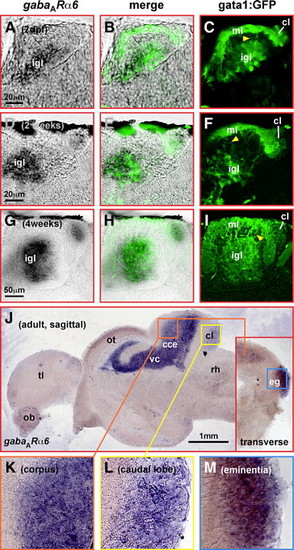
Sagittal brain sections of 1-, 2- and 4-week-old gata1:GFP transgenic larvae show that gabaARα6-expression (A, D, G) is localized to the internal granule cells layer (igl) of the corpus cerebelli and the granule cell containing caudal lobe (cl), respectively. The same is true for GFP-expression (C, F, I) at these different juvenile stages co-localizing to gabaARα6-expression (B, E, H). Moreover, GFP-containing parallel fibers of gata1:GFP cells extending from the internal granule cell layer (igl) into the molecular layer (ml) can be identified (C, F, I yellow arrowhead). In the adult brain, sagittal sections reveal gabaARα6-expression in the granule cell layer of the corpus cerebelli (J, K) and the caudal lobe (J, L), whereas transverse sections identify additional expression in the granule cell layer of the eminentia granularis (J inset, M). Abbr.: cce, corpus cerebelli; cl, caudal lobe; eg, eminentia granularis; igl, internal granule cell layer; MHB, midbrain–hindbrain boundary; ml, molecular layer; ob, olfactory bulb; ot, optic tectum; rh, rhombencephalon; tl, telencephalon; vc, valvula cerebelli. |
Reprinted from Developmental Biology, 313(1), Volkmann, K., Rieger, S., Babaryka, A., and Köster, R.W., The zebrafish cerebellar rhombic lip is spatially patterned in producing granule cell populations of different functional compartments, 167-180, Copyright (2008) with permission from Elsevier. Full text @ Dev. Biol.