FIGURE SUMMARY
Title

Innate immune evasion revealed in a colorectal zebrafish xenograft model

Authors
Póvoa, V., Rebelo de Almeida, C., Maia-Gil, M., Sobral, D., Domingues, M., Martinez-Lopez, M., de Almeida Fuzeta, M., Silva, C., Grosso, A.R., Fior, R.
Source
Full text @ Nat. Commun.

Human cancer cells display differential engraftment profiles in zebrafish.

a Engraftment is the ratio between the number of zebrafish xenografts that maintain a tumor at 4 days post injection (dpi) and the number of total xenografts that were originally successful injected and survived until day 4. MDA-MB-231 (MDA-231), MDA-MB-468 (MDA-468), and Hs578T are breast cancer cell lines. SW480, SW48, HT29, SW620, HCT116, and Hke3 are colorectal (CRC) cancer cell lines. Tumor cells were labeled and injected into the perivitelline space (PVS) of 2 days post-fertilization (dpf) zebrafish embryos. Each dot represents one independent experiment, number of independent experiments: 19 SW480, 3 SW48, 5 MDA-231 12 MDA-468, 5 HT29, 7 Hs578T, 22 SW620, 6 HCT116, 7 Hke3. Total number of xenografts analyzed (N) is depicted in the charts. Error bars indicate mean ± S.D. b Engraftment of SW480 and zebrafish patient-derived xenografts (zPDX-zAvatars) at 4 dpi, treated with FOLFOX (FO) and radiotherapy (RAD) and their respective controls. Each dot represents one independent experiment (3 SW480, 1 zPDX). Total number of xenografts analyzed (N) is depicted in the charts. Error bars indicate mean  ± S.D. See also Supplementary Fig. 1. cf Comparative transcriptomic analysis between SW480 and SW620 xenografts. c Schematic representation of the experiment where SW480 (in red) and SW620 (in green) tumors were dissected at 2 dpi for RNA extraction (~30 tumors of each condition). d Heatmap presents a two-dimensional dendogram (based on Pearson’s correlation coefficient distance) of log2 counts-per-million (logCPM), normalized expression values of differentially expressed genes (N = 459, cut-off of FDR < 0.05 and absolute log2FC > 1) in SW480 (low engraftment) versus SW620 (high engraftment) comparison, where colors represent expression values scaled by row (Z-scores). e, f GSEA of SW480 and SW620 xenografts. Source data are provided as a Source data file.

Progressor tumor cells are able to protect regressors from being cleared.

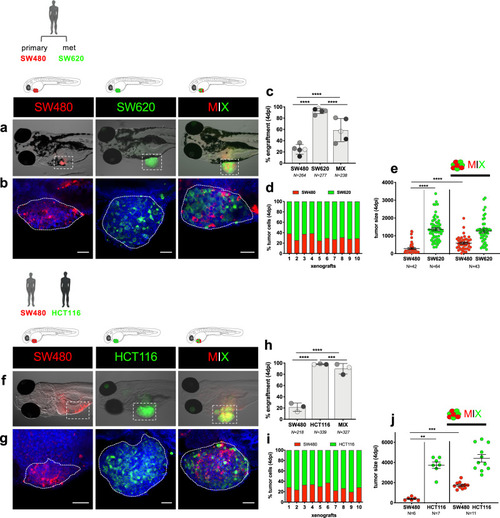
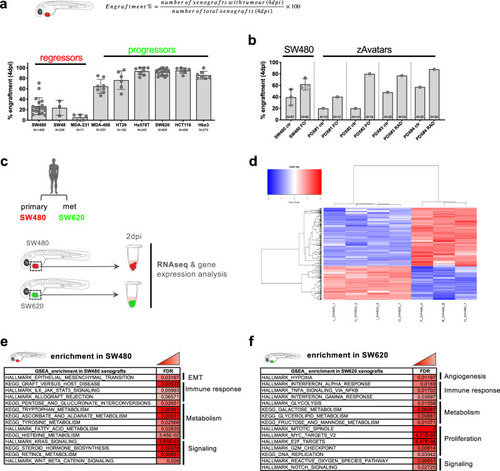
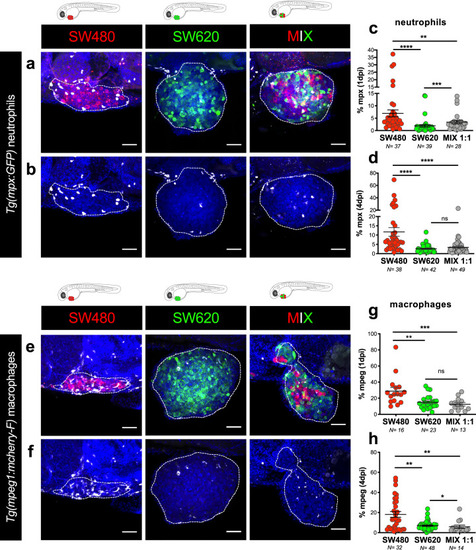
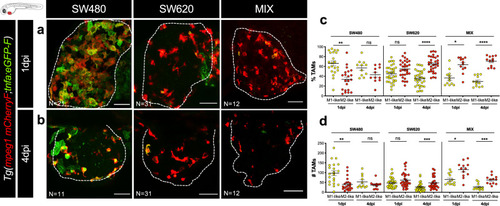
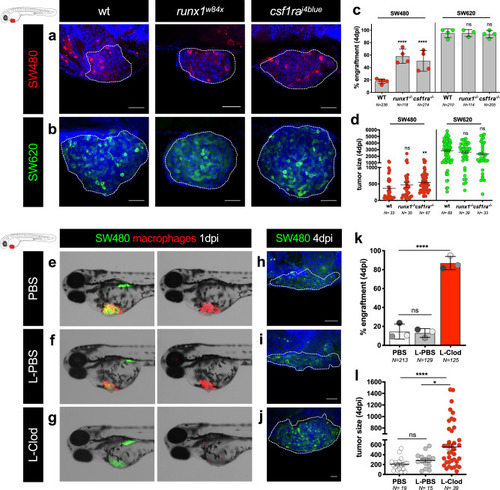
Tumor cells were labeled with lipophilic dyes and injected into the PVS of 2dpf zebrafish embryos. a, b Representative images of SW480 (in red), SW620 (in green), and MIX (1:1) polyclonal zebrafish xenografts at 4 dpi. a Fluorescence stereoscope images. b Confocal images. c Engraftment quantification at 4 dpi (Fisher exact test ****P < 0.0001). Graph shows the mean ± S.D. Each dot represents one independent experiments (5), and each set of independent experiments is represented in a different gray color. d Representative quantification of the proportions of each clone within each xenograft (N = 10) from four independent experiment. e Quantification of tumor size (no. of tumor cells) at 4 dpi (unpaired two-sided Mann–Whitney test ****P < 0.0001). Graph shows the mean ± SEM from four independent experiments, each dot represents one xenograft. f, g Representative images of SW480 (in red), HCT116 (in green), and MIX (1:1) zebrafish xenografts at 4 dpi. f Fluorescence stereoscope images. g Confocal images. h Engraftment quantification at 4 dpi (Fisher exact test ****P < 0.0001, ***P = 0.0005). Graph shows the mean ± S.D. Each dot represents one independent experiment (N = 3), and each set of independent experiments is in a different gray color. i Representative quantification of the cell proportions of each clone within each xenograft (N = 10) from one independent experiment. j Quantification of tumor size (no. of tumor cells) at 4 dpi (unpaired two-sided Mann–Whitney test **P = 0.0012, Cohen’s D g = 4.88; ***P = 0.0002, Cohen’s D g = 4.32). Graph shows the mean ± SEM from one independent experiment, each dot represents one xenograft. Scale bars: 50 μm. Dashed lines encircle tumor areas. Nuclei are stained with DAPI (blue). N is depicted in the charts. Source data are provided as a Source data file.

SW480_regressor TME is enriched in innate immune cells.

a, b Representative confocal projection images of neutrophils in SW480, SW620, and MIX tumors from Tg(mpx:eGFP) zebrafish xenografts at 4 dpi. c, d Quantification of neutrophils percentage (no. of neutrophils/no. of tumor cells x 100) within SW480, SW620, and MIX TME, at 1 dpi (c, ****P < 0.0001, ***P = 0.0002, **P = 0.0094) and 4 dpi (d, ****P < 0.0001, ns = 0.39). e, f Representative confocal projection images of macrophages in SW480, SW620, and MIX tumors from Tg(mpeg1:mcherry-F) zebrafish xenografts at 4 dpi. g, h Quantification of macrophage percentage (no. of macrophages/no. of tumor cells x 100) within SW480, SW620, and MIX tumors, at 1 dpi (g, ***P = 0.0009, **P = 0.0011, ns = 0.45) and 4 dpi (h, 480 vs 620 **P = 0.0089, 480 vs MIX **P = 0.0025, *P = 0.024). SW480 (red) and SW620 (green), neutrophils (white) and macrophages (white) fake colors. Scale bars: 50 μm. Dashed lines encircle tumor areas. Nuclei are stained with DAPI. N is depicted in the chart. Each dot represents one xenograft. Error bars indicate mean ± SEM (from three independent experiments). All data were analyzed using unpaired two-sided Mann–Whitney test. See also Supplementary Fig. 3. Source data are provided as a Source data file.

SW480 and SW620 human tumor cells modulate zebrafish macrophage polarization.

a, b Representative confocal images of SW480, SW620, and MIX xenografts injected in Tg(mpeg1:mcherry-F, tnfa:GFP-F) at 1 and 4 dpi. Red: macrophages; green: TNFa+ cells; yellow: overlay of macrophages in red and TNFa+ cells in green—M1-like macrophages. c Proportion of M1- and M2-like macrophages in the TME at 1 and 4 dpi (paired two-sided t test, **P = 0.0033, ns = 0.1833, ns = 0.1160, ****P < 0.0001, *P = 0.0116, ****P < 0.0001). d Quantification of absolute numbers of M1- and M2-like macrophages in the TME at 1 and 4 dpi (paired two-sided Wilcoxon rank test **P = 0.0016, ns = 0.3086, ns = 0.1473, ***P < 0.0002, *P = 0.0205, ***P < 0.0005). Scale bars: 50 μm. Dashed lines encircle tumor areas. N is depicted in the images. In c and d, the number of xenografts analyzed is: SW480_1 dpi N = 21, SW480_4 dpi N = 11, SW620_1 dpi N = 31, SW620_4 dpi N = 31, MIX_1 dpi N = 12, and MIX_4 dpi N = 12. Images are maximum intensity projections. Each dot represents one xenograft. Error bars indicate mean ± SEM (from 2 independent experiments in SW480, 3 in SW620, and 1 experiment for the MIX). Source data are provided as a Source data file.

Zebrafish innate immune cells regulate clearance of SW480 tumor cells.

a, b Representative confocal images of SW480 and SW620 xenografts in runx1w84x and csf1raj4blue (panther) mutants. SW480 were labeled in red and SW620 in green. c Quantification of engraftment in runx1w84x and csf1raj4blue (panther) mutants and respective controls (Fisher exact test, ****P < 0.0001, SW620 wt vs SW620 runx1w84x ns = 0.62, SW620 wt vs SW620 panther ns = 0.09). Error bars represent mean ± S.D. Each dot represents one independent experiment. d Quantification of tumor size in runx1w84x and csf1raj4blue (panther) mutants and respective controls (unpaired two-sided Mann–Whitney test—SW480 wt vs SW480 runx1w84x ns = 0.22, **P = 0.0013, SW620 wt vs SW620 runx1w84x ns = 0.44, SW620 wt vs SW620 panther ns = 0.18). Error bars represent mean ± SEM, each dot represents one xenograft from 3 independent experiments. ej Zebrafish embryos with 2 dpf were injected simultaneously with SW480 tumor cells (in green) with PBS (control), with L-PBS or with L-Clodronate liposomes into Tg(mpeg1:mcherry) background (macrophages in red). eg Representative fluorescence stereoscope images of SW480 xenografts at 1 dpi in the different conditions. hj Representative confocal images of SW480 xenografts at 4 dpi. k Quantification of engraftment: Fisher exact test ns = 0.83, ****P < 0.0001; error bars represent mean ± S.D.; each dot represents one independent experiment, and each set of independent experiment is represented in a different gray color. l Quantification of tumor size—no. of tumor cells (unpaired two-sided Mann–Whitney test ns = 0.062, ****P < 0.0001, *P = 0.022, error bars represent mean ± SEM) in the different experimental conditions at 4 dpi, each dot represents one xenograft from 3 independent experiments. Scale bars: 50 μm. White dashed lines encircle tumor areas. Nuclei are stained with DAPI. N is depicted in the chart. See also Supplementary Fig. 6. Source data are provided as a Source data file.

Mice xenografts display similar TME behavior as zebrafish.

ac Representative graphs of flow cytometry analysis of the TME of SW480, SW620, and MIX mouse (Rag1−/−C57BL/6J) xenografts at 3 weeks post inoculation. d Quantification of double positive F4/80, CD80 macrophage in each TME, SW620 vs SW480. *P = 0.016, Cohen’s D g = 6.2; SW620 vs MIX ns = 0.29, Cohen’s D g = 0.83; SW480 vs MIX *P = 0.029, Cohen’s D g = 1.28). e Quantification of the percentage of each clone in MIX mice xenografts, *P = 0.029, Cohen’s D g = 7.68. d, e Data from quantification of flow cytometry analysis. Error bars represent mean ± S.D. f Growth curves of SW480 tumors treated with PBS, L-PBS, or L-Clodronate mice (f ns = 0.43, Cohen’s D g = 0.12, **P = 0.007, Cohen’s D g = 2.16, *P = 0.017, Cohen’s D g = 1.92). Error bars represent mean ± SEM. All data were analyzed using unpaired two-sided Mann–Whitney test. To avoid macrophage repopulation, mice were injected every 4 days (see “Methods”). N is depicted in the chart. Each dot represents one mouse xenograft. Source data are provided as a Source data file.

Innate immunoediting in zebrafish xenografts.

a Schematic illustration of SW480 escaper cells selection from SW480 parental xenografted (see “Methods” for more info). b Representative confocal images of tumoral masses of SW480 parental and SW480zEscapers xenografts at 4 dpi. c Quantification of engraftment at 4 dpi (Fisher exact test ****P < 0.0001). Error bars represent mean ± S.D. Each dot represents one independent experiment. d Quantification of tumor size—no. of tumor cells, at 4 dpi (unpaired two-sided Mann–Whitney test ****P < 0.0001). e Quantification of mitotic tumor cells at 4 dpi (unpaired two-sided Mann–Whitney test ns = 0.25). f Quantification of apoptotic tumor cells at 4 dpi (unpaired two-sided Mann–Whitney test *P = 0.01). g Quantification of macrophage present in the TME of SW480 parental versus SW480Zesc at 4 dpi (unpaired two-sided Mann–Whitney test ****P < 0.0001). In dot plots, error bars represent mean ± SEM. Scale bars: 50 μm. Dashed lines encircle tumor areas. Nuclei are stained with DAPI. N is depicted in the chart. Each dot represents one xenograft. Data of SW480zEscapers results from three independent injections. Source data are provided as a Source data file.

Single-cell transcriptome profiling reveals the clearance and expansion of different SW480 subclones.

a Schematic illustration of the design of the experiment. SW480 cells were injected into 2 dpf zebrafish embryos, and at 1 and 4 dpi, tumors were dissected and processed for scRNAseq. b Relative frequencies of the cell clusters present in each library replicate. c Uniform Manifold Approximation and Projection (UMAP), representing the relative similarity between individual cells, colored by cell cluster and divided by timepoints 1 and 4 dpi. d Heatmap representation of normalized enrichment scores (NES) of representative pathways with statistically significant (adjusted P-value < 0.05) enrichment in gene set enrichment analysis (GSEA), comparing the gene expression of each cellular subgroup to all the others. Red colors mean that genes in that pathway tend to be more expressed in that cellular subcluster, while blue means that genes tend to be less expressed. Significant NES values are marked with asterisk (Fisher exact test *: adjusted P-value < 0.05; **: adjusted P-value < 0.01; ***: adjusted P-value < 0.001). Gray colors are cases where a NES value could not be obtained and should be considered non-significant (see Supplementary Data 2 for GSE values). e Schematic illustration of expansion/reduction of each cluster from 1 to 4 dpi with the most representative pathways and genes.

Acknowledgments
This image is the copyrighted work of the attributed author or publisher, and ZFIN has permission only to display this image to its users. Additional permissions should be obtained from the applicable author or publisher of the image. Full text @ Nat. Commun.