|
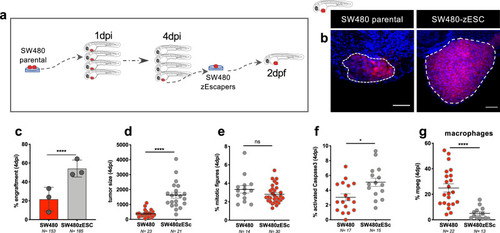
Innate immunoediting in zebrafish xenografts.a Schematic illustration of SW480 escaper cells selection from SW480 parental xenografted (see “Methods” for more info). b Representative confocal images of tumoral masses of SW480 parental and SW480zEscapers xenografts at 4 dpi. c Quantification of engraftment at 4 dpi (Fisher exact test ****P < 0.0001). Error bars represent mean ± S.D. Each dot represents one independent experiment. d Quantification of tumor size—no. of tumor cells, at 4 dpi (unpaired two-sided Mann–Whitney test ****P < 0.0001). e Quantification of mitotic tumor cells at 4 dpi (unpaired two-sided Mann–Whitney test ns = 0.25). f Quantification of apoptotic tumor cells at 4 dpi (unpaired two-sided Mann–Whitney test *P = 0.01). g Quantification of macrophage present in the TME of SW480 parental versus SW480Zesc at 4 dpi (unpaired two-sided Mann–Whitney test ****P < 0.0001). In dot plots, error bars represent mean ± SEM. Scale bars: 50 μm. Dashed lines encircle tumor areas. Nuclei are stained with DAPI. N is depicted in the chart. Each dot represents one xenograft. Data of SW480zEscapers results from three independent injections. Source data are provided as a Source data file.
|