|
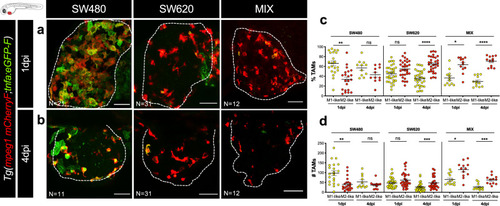
SW480 and SW620 human tumor cells modulate zebrafish macrophage polarization.a, b Representative confocal images of SW480, SW620, and MIX xenografts injected in Tg(mpeg1:mcherry-F, tnfa:GFP-F) at 1 and 4 dpi. Red: macrophages; green: TNFa+ cells; yellow: overlay of macrophages in red and TNFa+ cells in green—M1-like macrophages. c Proportion of M1- and M2-like macrophages in the TME at 1 and 4 dpi (paired two-sided t test, **P = 0.0033, ns = 0.1833, ns = 0.1160, ****P < 0.0001, *P = 0.0116, ****P < 0.0001). d Quantification of absolute numbers of M1- and M2-like macrophages in the TME at 1 and 4 dpi (paired two-sided Wilcoxon rank test **P = 0.0016, ns = 0.3086, ns = 0.1473, ***P < 0.0002, *P = 0.0205, ***P < 0.0005). Scale bars: 50 μm. Dashed lines encircle tumor areas. N is depicted in the images. In c and d, the number of xenografts analyzed is: SW480_1 dpi N = 21, SW480_4 dpi N = 11, SW620_1 dpi N = 31, SW620_4 dpi N = 31, MIX_1 dpi N = 12, and MIX_4 dpi N = 12. Images are maximum intensity projections. Each dot represents one xenograft. Error bars indicate mean ± SEM (from 2 independent experiments in SW480, 3 in SW620, and 1 experiment for the MIX). Source data are provided as a Source data file.
|