|
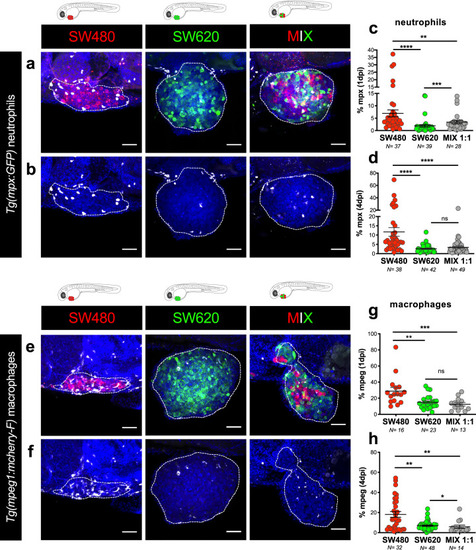
SW480_regressor TME is enriched in innate immune cells.a, b Representative confocal projection images of neutrophils in SW480, SW620, and MIX tumors from Tg(mpx:eGFP) zebrafish xenografts at 4 dpi. c, d Quantification of neutrophils percentage (no. of neutrophils/no. of tumor cells x 100) within SW480, SW620, and MIX TME, at 1 dpi (c, ****P < 0.0001, ***P = 0.0002, **P = 0.0094) and 4 dpi (d, ****P < 0.0001, ns = 0.39). e, f Representative confocal projection images of macrophages in SW480, SW620, and MIX tumors from Tg(mpeg1:mcherry-F) zebrafish xenografts at 4 dpi. g, h Quantification of macrophage percentage (no. of macrophages/no. of tumor cells x 100) within SW480, SW620, and MIX tumors, at 1 dpi (g, ***P = 0.0009, **P = 0.0011, ns = 0.45) and 4 dpi (h, 480 vs 620 **P = 0.0089, 480 vs MIX **P = 0.0025, *P = 0.024). SW480 (red) and SW620 (green), neutrophils (white) and macrophages (white) fake colors. Scale bars: 50 μm. Dashed lines encircle tumor areas. Nuclei are stained with DAPI. N is depicted in the chart. Each dot represents one xenograft. Error bars indicate mean ± SEM (from three independent experiments). All data were analyzed using unpaired two-sided Mann–Whitney test. See also Supplementary Fig. 3. Source data are provided as a Source data file.
|