|
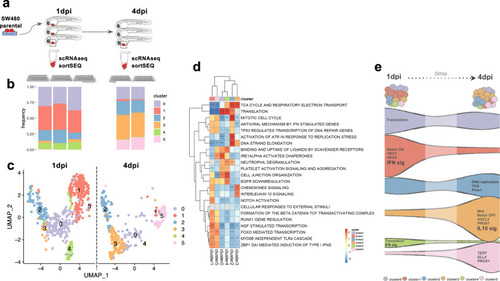
Single-cell transcriptome profiling reveals the clearance and expansion of different SW480 subclones.a Schematic illustration of the design of the experiment. SW480 cells were injected into 2 dpf zebrafish embryos, and at 1 and 4 dpi, tumors were dissected and processed for scRNAseq. b Relative frequencies of the cell clusters present in each library replicate. c Uniform Manifold Approximation and Projection (UMAP), representing the relative similarity between individual cells, colored by cell cluster and divided by timepoints 1 and 4 dpi. d Heatmap representation of normalized enrichment scores (NES) of representative pathways with statistically significant (adjusted P-value < 0.05) enrichment in gene set enrichment analysis (GSEA), comparing the gene expression of each cellular subgroup to all the others. Red colors mean that genes in that pathway tend to be more expressed in that cellular subcluster, while blue means that genes tend to be less expressed. Significant NES values are marked with asterisk (Fisher exact test *: adjusted P-value < 0.05; **: adjusted P-value < 0.01; ***: adjusted P-value < 0.001). Gray colors are cases where a NES value could not be obtained and should be considered non-significant (see Supplementary Data 2 for GSE values). e Schematic illustration of expansion/reduction of each cluster from 1 to 4 dpi with the most representative pathways and genes.
|