|
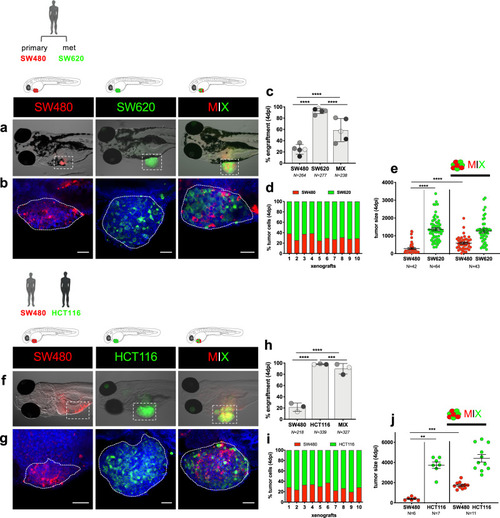
Progressor tumor cells are able to protect regressors from being cleared.Tumor cells were labeled with lipophilic dyes and injected into the PVS of 2dpf zebrafish embryos. a, b Representative images of SW480 (in red), SW620 (in green), and MIX (1:1) polyclonal zebrafish xenografts at 4 dpi. a Fluorescence stereoscope images. b Confocal images. c Engraftment quantification at 4 dpi (Fisher exact test ****P < 0.0001). Graph shows the mean ± S.D. Each dot represents one independent experiments (5), and each set of independent experiments is represented in a different gray color. d Representative quantification of the proportions of each clone within each xenograft (N = 10) from four independent experiment. e Quantification of tumor size (no. of tumor cells) at 4 dpi (unpaired two-sided Mann–Whitney test ****P < 0.0001). Graph shows the mean ± SEM from four independent experiments, each dot represents one xenograft. f, g Representative images of SW480 (in red), HCT116 (in green), and MIX (1:1) zebrafish xenografts at 4 dpi. f Fluorescence stereoscope images. g Confocal images. h Engraftment quantification at 4 dpi (Fisher exact test ****P < 0.0001, ***P = 0.0005). Graph shows the mean ± S.D. Each dot represents one independent experiment (N = 3), and each set of independent experiments is in a different gray color. i Representative quantification of the cell proportions of each clone within each xenograft (N = 10) from one independent experiment. j Quantification of tumor size (no. of tumor cells) at 4 dpi (unpaired two-sided Mann–Whitney test **P = 0.0012, Cohen’s D g = 4.88; ***P = 0.0002, Cohen’s D g = 4.32). Graph shows the mean ± SEM from one independent experiment, each dot represents one xenograft. Scale bars: 50 μm. Dashed lines encircle tumor areas. Nuclei are stained with DAPI (blue). N is depicted in the charts. Source data are provided as a Source data file.
|