|
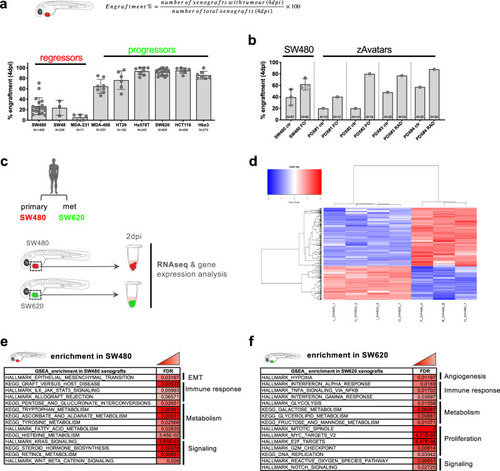
Human cancer cells display differential engraftment profiles in zebrafish.a Engraftment is the ratio between the number of zebrafish xenografts that maintain a tumor at 4 days post injection (dpi) and the number of total xenografts that were originally successful injected and survived until day 4. MDA-MB-231 (MDA-231), MDA-MB-468 (MDA-468), and Hs578T are breast cancer cell lines. SW480, SW48, HT29, SW620, HCT116, and Hke3 are colorectal (CRC) cancer cell lines. Tumor cells were labeled and injected into the perivitelline space (PVS) of 2 days post-fertilization (dpf) zebrafish embryos. Each dot represents one independent experiment, number of independent experiments: 19 SW480, 3 SW48, 5 MDA-231 12 MDA-468, 5 HT29, 7 Hs578T, 22 SW620, 6 HCT116, 7 Hke3. Total number of xenografts analyzed (N) is depicted in the charts. Error bars indicate mean ± S.D. b Engraftment of SW480 and zebrafish patient-derived xenografts (zPDX-zAvatars) at 4 dpi, treated with FOLFOX (FO) and radiotherapy (RAD) and their respective controls. Each dot represents one independent experiment (3 SW480, 1 zPDX). Total number of xenografts analyzed (N) is depicted in the charts. Error bars indicate mean ± S.D. See also Supplementary Fig. 1. c–f Comparative transcriptomic analysis between SW480 and SW620 xenografts. c Schematic representation of the experiment where SW480 (in red) and SW620 (in green) tumors were dissected at 2 dpi for RNA extraction (~30 tumors of each condition). d Heatmap presents a two-dimensional dendogram (based on Pearson’s correlation coefficient distance) of log2 counts-per-million (logCPM), normalized expression values of differentially expressed genes (N = 459, cut-off of FDR < 0.05 and absolute log2FC > 1) in SW480 (low engraftment) versus SW620 (high engraftment) comparison, where colors represent expression values scaled by row (Z-scores). e, f GSEA of SW480 and SW620 xenografts. Source data are provided as a Source data file.
|