|
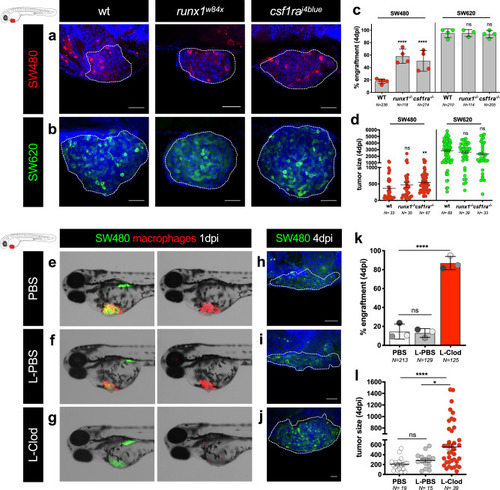
Zebrafish innate immune cells regulate clearance of SW480 tumor cells.a, b Representative confocal images of SW480 and SW620 xenografts in runx1w84x and csf1raj4blue (panther) mutants. SW480 were labeled in red and SW620 in green. c Quantification of engraftment in runx1w84x and csf1raj4blue (panther) mutants and respective controls (Fisher exact test, ****P < 0.0001, SW620 wt vs SW620 runx1w84x ns = 0.62, SW620 wt vs SW620 panther ns = 0.09). Error bars represent mean ± S.D. Each dot represents one independent experiment. d Quantification of tumor size in runx1w84x and csf1raj4blue (panther) mutants and respective controls (unpaired two-sided Mann–Whitney test—SW480 wt vs SW480 runx1w84x ns = 0.22, **P = 0.0013, SW620 wt vs SW620 runx1w84x ns = 0.44, SW620 wt vs SW620 panther ns = 0.18). Error bars represent mean ± SEM, each dot represents one xenograft from 3 independent experiments. e–j Zebrafish embryos with 2 dpf were injected simultaneously with SW480 tumor cells (in green) with PBS (control), with L-PBS or with L-Clodronate liposomes into Tg(mpeg1:mcherry) background (macrophages in red). e–g Representative fluorescence stereoscope images of SW480 xenografts at 1 dpi in the different conditions. h–j Representative confocal images of SW480 xenografts at 4 dpi. k Quantification of engraftment: Fisher exact test ns = 0.83, ****P < 0.0001; error bars represent mean ± S.D.; each dot represents one independent experiment, and each set of independent experiment is represented in a different gray color. l Quantification of tumor size—no. of tumor cells (unpaired two-sided Mann–Whitney test ns = 0.062, ****P < 0.0001, *P = 0.022, error bars represent mean ± SEM) in the different experimental conditions at 4 dpi, each dot represents one xenograft from 3 independent experiments. Scale bars: 50 μm. White dashed lines encircle tumor areas. Nuclei are stained with DAPI. N is depicted in the chart. See also Supplementary Fig. 6. Source data are provided as a Source data file.
|