IMAGE

Fig. 5

ID
ZDB-IMAGE-210307-70
Source
Figures for Póvoa et al., 2021
Image
Figure Caption

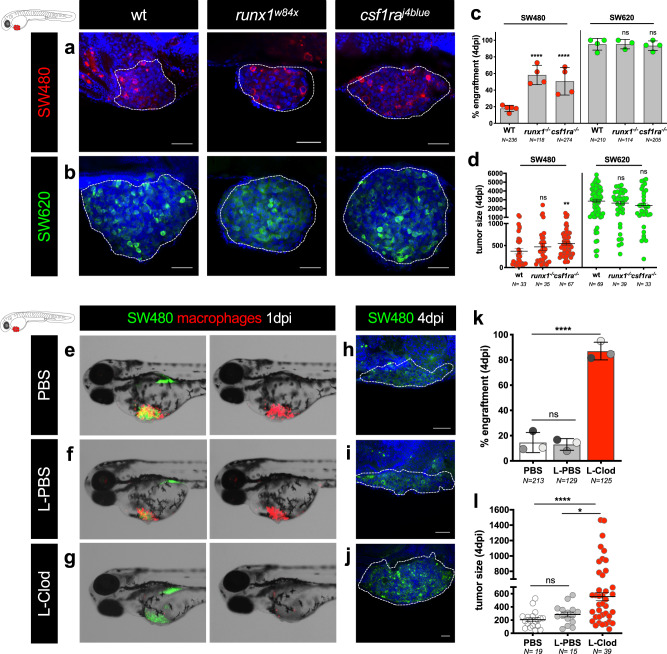
Fig. 5 Zebrafish innate immune cells regulate clearance of SW480 tumor cells.

a, b Representative confocal images of SW480 and SW620 xenografts in runx1w84x and csf1raj4blue (panther) mutants. SW480 were labeled in red and SW620 in green. c Quantification of engraftment in runx1w84x and csf1raj4blue (panther) mutants and respective controls (Fisher exact test, ****P < 0.0001, SW620 wt vs SW620 runx1w84x ns = 0.62, SW620 wt vs SW620 panther ns = 0.09). Error bars represent mean ± S.D. Each dot represents one independent experiment. d Quantification of tumor size in runx1w84x and csf1raj4blue (panther) mutants and respective controls (unpaired two-sided Mann–Whitney test—SW480 wt vs SW480 runx1w84x ns = 0.22, **P = 0.0013, SW620 wt vs SW620 runx1w84x ns = 0.44, SW620 wt vs SW620 panther ns = 0.18). Error bars represent mean ± SEM, each dot represents one xenograft from 3 independent experiments. ej Zebrafish embryos with 2 dpf were injected simultaneously with SW480 tumor cells (in green) with PBS (control), with L-PBS or with L-Clodronate liposomes into Tg(mpeg1:mcherry) background (macrophages in red). eg Representative fluorescence stereoscope images of SW480 xenografts at 1 dpi in the different conditions. hj Representative confocal images of SW480 xenografts at 4 dpi. k Quantification of engraftment: Fisher exact test ns = 0.83, ****P < 0.0001; error bars represent mean ± S.D.; each dot represents one independent experiment, and each set of independent experiment is represented in a different gray color. l Quantification of tumor size—no. of tumor cells (unpaired two-sided Mann–Whitney test ns = 0.062, ****P < 0.0001, *P = 0.022, error bars represent mean ± SEM) in the different experimental conditions at 4 dpi, each dot represents one xenograft from 3 independent experiments. Scale bars: 50 μm. White dashed lines encircle tumor areas. Nuclei are stained with DAPI. N is depicted in the chart. See also Supplementary Fig. 6. Source data are provided as a Source data file.

Acknowledgments
This image is the copyrighted work of the attributed author or publisher, and ZFIN has permission only to display this image to its users. Additional permissions should be obtained from the applicable author or publisher of the image. Full text @ Nat. Commun.