
- Title
-
Functional Heterogeneity within the Developing Zebrafish Epicardium
- Authors
- Weinberger, M., Simões, F.C., Patient, R., Sauka-Spengler, T., Riley, P.R.
- Source
- Full text @ Dev. Cell
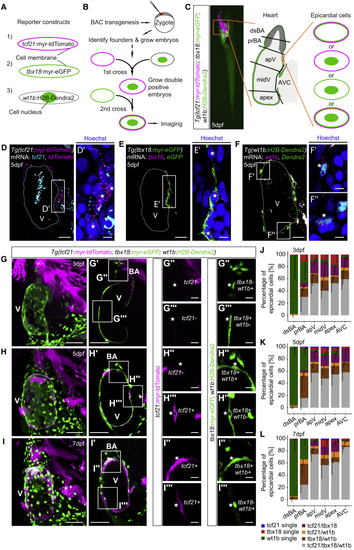
Heterogeneous Expression of (A) Fluorescence of (B) Workflow to establish (D–F) Single optical sections of mRNA stainings of (D) (G–I) Projections of the heart in triple reporter larvae at 3 dpf (G), 5 dpf (H), and 7 dpf (I). (G′ and H′) Single optical sections from (G) and (H). (I′) Short projection from (I). (G″–I″ and G‴–I‴) Representative epicardial fluorescence patterns. (J–L) Relative quantification of epicardial fluorescence patterns across the regions indicated in (C) at 3 dpf (J), 5 dpf (K), and 7 dpf (L). Scale bars: 20 μm in (D)–(F), 5 μm in (D′)–(F′), 50 μm in (G)–(I) and (G′)–(I′), and 10 μm in (G″)–(I″) and (G‴)–(I‴). Color channels were adjusted separately for brightness and contrast. Data in (J)–(L) are represented as mean minus standard deviation. Number of embryos analyzed: 3 dpf n = 6, 5 dpf n = 10, and 7 dpf n = 6. V, ventricle; BA, bulbus arteriosus. See also EXPRESSION / LABELING:
|
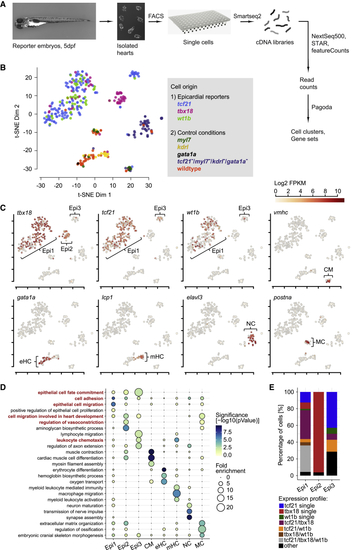
Single-Cell RNA Sequencing Reveals Distinct Epicardial Cell Clusters in the Developing Zebrafish Heart (A) Overview of the scRNA-seq workflow. (B) t-distributed stochastic neighbor embedding (t-SNE) clustering of single-cell samples. Colors indicate the reporter or WT line cells were isolated from. (C) Identification of single-cell clusters based on marker gene expression. Three clusters labeled by (D) GO term over-representation in the clusters (columns). Bubble size depicts fold enrichment and color scale depicts the statistical significance, with p-values calculated using Fisher’s exact test and Bonferroni correction for multiple hypothesis testing. GO terms important for further analysis are highlighted in red. (E) Relative quantification of the combinations of See also |
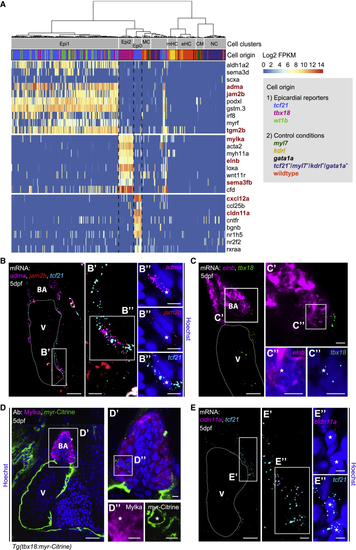
Transcriptionally Distinct Epicardial Subpopulations Epi1–3 Localize to Different Regions of the Developing Heart (A) Marker gene expression in Epi1–3. Cells were clustered in an unsupervised manner (columns). Color key indicates range of log2 transformed FPKM values. Genes analyzed further are highlighted in red. CM, cardiomyocyte; eHC, erythroid hematopoietic cell; mHC, myeloid hematopoietic cell; NC, neural cell; and MC, mesenchymal cell. (B) mRNA staining of the Epi1 markers (C) mRNA staining of the Epi2 marker (D) Antibody staining of Mylka and (E) mRNA staining of the Epi3 marker |
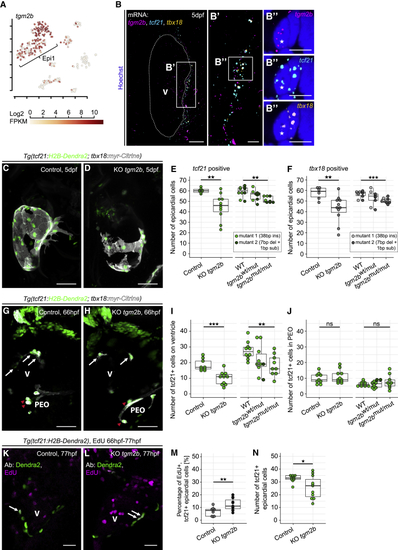
(A) Expression of (B) mRNA staining of (C) The epicardium in a 5 dpf control larva. (D) Disrupted epicardial integrity in a 5 dpf KO (E) Absolute quantification of (F) Absolute quantification of (G) The epicardium in a 66 hpf control embryo. White arrows indicate epicardial cells, and red arrowheads indicate cells in the PEO. (H) Reduced epicardial cell numbers in a 66 hpf KO (I and J) Absolute quantification of (K) Proliferation in the epicardium of a 77 hpf control larva (white arrows). (L) Increased epicardial proliferation in a KO (M) Relative quantification of proliferating epicardial cells. (N) Absolute quantification of See also |
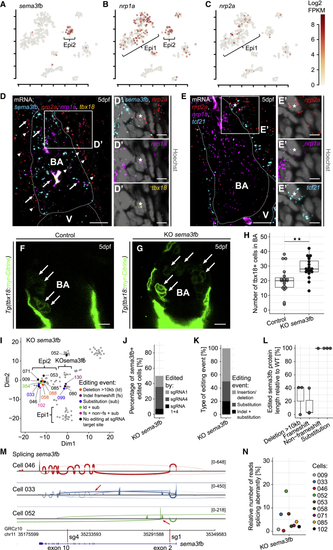
(A–C) Expression of (D) mRNA staining of (E) mRNA staining of (F) The BA in a 5 dpf control larva. (G) Increased numbers of (H) Absolute quantification of (I–N) Analysis of gene editing in single Scale bars: 10 μm in (D)–(G) and 5 μm in (D′) and (E′). Color channels were adjusted separately for brightness and contrast. (D)–(G) are single optical sections. Data in (H) and (L) are represented as median, first, and third quartiles (box). Significance calculated using Welch’s t test. ∗∗p < 0.01. V, ventricle; BA, bulbus arteriosus. See also |
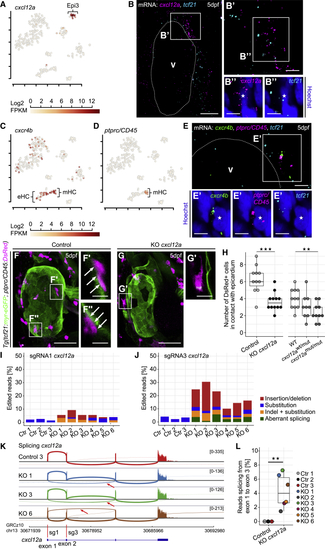
The Chemokine (A) Expression of (B) mRNA staining of (C and D) Expression of (E) mRNA staining of (F) The heart in a 5 dpf control larva. (F′ and F″) (G and G′) Fewer (H) Absolute quantification of (I and J) RNA-seq analysis of (K) Sashimi plots showing splicing of (L) Relative number of reads splicing from Scale bars: 50 μm in (F) and (G); 20 μm in (B); 10 μm in (F′), (F″), and (G′), and 5 μm in (B′), (B″), (E), and (E′). Color channels were adjusted separately for brightness and contrast. (F) and (G) are projections; (B), (E), (F′), (F″), and (G′) are single optical sections. Data in (H) and (L) are represented as median, first, and third quartiles (box). Significance calculated using Welch’s t test. ∗∗p < 0.01, ∗∗∗p < 0.001. V, ventricle; eHC, erythroid hematopoietic cell; mHC, myeloid hematopoietic cell. See also EXPRESSION / LABELING:
|
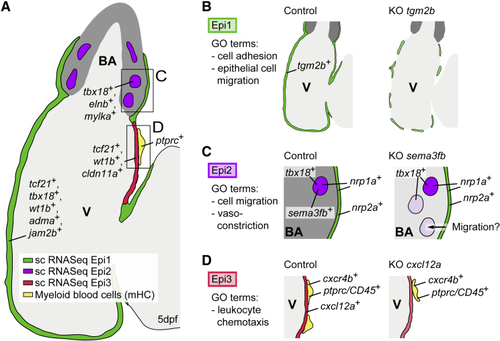
Summary of the Distinct Epicardial Cell Populations in the Developing Zebrafish Heart (A) Zebrafish heart at 5 dpf, showing the distributions of Epi1-3. (B) Loss of (C) Loss of (D) Loss of |
Reprinted from Developmental Cell, 52(5), Weinberger, M., Simões, F.C., Patient, R., Sauka-Spengler, T., Riley, P.R., Functional Heterogeneity within the Developing Zebrafish Epicardium, 574-590.e6, Copyright (2020) with permission from Elsevier. Full text @ Dev. Cell