FIGURE

Figure 4

ID
ZDB-FIG-200318-13
Publication
Weinberger et al., 2020 - Functional Heterogeneity within the Developing Zebrafish Epicardium
Other Figures
All Figure Page
Back to All Figure Page
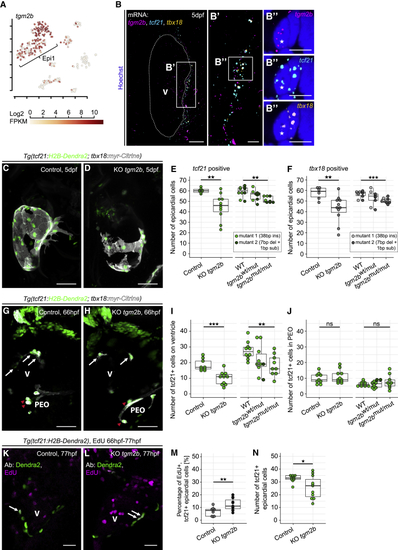
Figure 4

Transglutaminase 2b Is Enriched in Epi1 and Functions to Maintain the Integrity of the Epicardial Cell Layer

(A) Expression of tgm2b. Color key indicates range of log2 transformed FPKM values.

(B) mRNA staining of tgm2b (magenta), tcf21 (cyan), and tbx18 (orange) in a 5 dpf heart. (B′ and B″) A nucleus (asterisk) in the epicardial region surrounded by tgm2b, tcf21, and tbx18.

(C) The epicardium in a 5 dpf control larva.

(D) Disrupted epicardial integrity in a 5 dpf KO tgm2b larva.

(E) Absolute quantification of tcf21:H2B-Dendra2+ epicardial cell numbers at 5 dpf in transient tgm2b knockouts (Control, KO tgm2b) and stable tgm2b mutants (heterozygous, tgm2bwt/mut; homozygous, tgm2bmut/mut). Larvae from two mutant lines were analyzed.

(F) Absolute quantification of tbx18:myr-Citrine+ epicardial cell numbers at 5 dpf.

(G) The epicardium in a 66 hpf control embryo. White arrows indicate epicardial cells, and red arrowheads indicate cells in the PEO.

(H) Reduced epicardial cell numbers in a 66 hpf KO tgm2b embryo.

(I and J) Absolute quantification of tcf21:H2B-Dendra2+ epicardial (I) and proepicardial (J) cell numbers at 66 hpf.

(K) Proliferation in the epicardium of a 77 hpf control larva (white arrows).

(L) Increased epicardial proliferation in a KO tgm2b larva.

(M) Relative quantification of proliferating epicardial cells.

(N) Absolute quantification of tcf21:H2B-Dendra2+ epicardial cells. Scale bars: 50 μm in (C), (D), (G), and (H); 20 μm in (B); 10 μm in (K) and (L); and 5 μm in (B′) and (B″). Color channels were adjusted separately for brightness and contrast. (C), (D), (G), and (H) are projections; (B), (K), and (L) are single optical sections. Data are represented as median, first, and third quartiles (box). Significance was calculated using Welch’s t test. p < 0.05, ∗∗p < 0.01, ∗∗∗p < 0.001. V, ventricle; Ab, antibody.

See also Figure S6.

Expression Data
Genes:
Fish:
Knockdown Reagents:
Anatomical Terms:
Stage: Day 5

Expression Detail
Antibody Labeling
Phenotype Data
Fish:
Knockdown Reagents:
Observed In:
Stage Range: Pec-fin to Day 5

Phenotype Detail
Acknowledgments
This image is the copyrighted work of the attributed author or publisher, and ZFIN has permission only to display this image to its users. Additional permissions should be obtained from the applicable author or publisher of the image.

Reprinted from Developmental Cell, 52(5), Weinberger, M., Simões, F.C., Patient, R., Sauka-Spengler, T., Riley, P.R., Functional Heterogeneity within the Developing Zebrafish Epicardium, 574-590.e6, Copyright (2020) with permission from Elsevier. Full text @ Dev. Cell