FIGURE

Figure 6

ID
ZDB-FIG-200318-15
Publication
Weinberger et al., 2020 - Functional Heterogeneity within the Developing Zebrafish Epicardium
Other Figures
All Figure Page
Back to All Figure Page
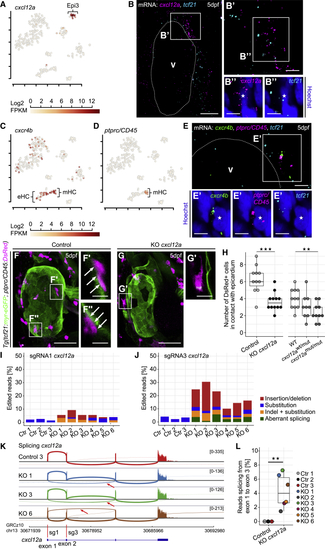
Figure 6

The Chemokine cxcl12a Is Expressed in Epi3 and Attracts ptprc+ Leukocytes to the Epicardium

(A) Expression of cxcl12a. Color key indicates range of log2 transformed FPKM values.

(B) mRNA staining of cxcl12a (magenta) and tcf21 (cyan) at 5 dpf. (B′ and B″) A nucleus (asterisk) in the epicardial region between BA and atrium surrounded by cxcl12a and tcf21.

(C and D) Expression of cxcr4b (C) and ptprc (D). Color key indicates range of log2 transformed FPKM values.

(E) mRNA staining of cxcr4b (green), ptprc (magenta), and tcf21 (cyan) at 5 dpf. (E′) A nucleus (asterisk) in close proximity to cxcr4b and ptprc.

(F) The heart in a 5 dpf control larva. (F′ and F″) ptprc/Cd45:DsRed+ cells in contact with the epicardium (arrows).

(G and G′) Fewer ptprc/CD45:DsRed+ cells on the heart of a 5 dpf KO cxcl12a larva.

(H) Absolute quantification of ptprc/CD45:DsRed+ cells in contact with the epicardium in transient cxcl12a knockouts (Control, KO cxcl12a) and stable cxcl12a mutants (heterozygous, cxcl12awt/mut; homozygous, cxcl12amut/mut).

(I and J) RNA-seq analysis of cxcl12a gene editing in single control (ctr) and cxcl12a-knockout (KO) larvae. Relative numbers of edited reads that spanned the target site of cxcl12a sgRNA1 (I) or sgRNA3 (J).

(K) Sashimi plots showing splicing of cxcl12a. Arrows highlight reads splicing from exon 1 into exon 3. Red bars indicate sgRNA target sites.

(L) Relative number of reads splicing from cxcl12a exon 1 that spliced from exon 1 into exon 3.

Scale bars: 50 μm in (F) and (G); 20 μm in (B); 10 μm in (F′), (F″), and (G′), and 5 μm in (B′), (B″), (E), and (E′). Color channels were adjusted separately for brightness and contrast. (F) and (G) are projections; (B), (E), (F′), (F″), and (G′) are single optical sections. Data in (H) and (L) are represented as median, first, and third quartiles (box). Significance calculated using Welch’s t test. ∗∗p < 0.01, ∗∗∗p < 0.001. V, ventricle; eHC, erythroid hematopoietic cell; mHC, myeloid hematopoietic cell.

See also Figure S7.

Expression Data
Genes:
Fish:
Anatomical Term:
Stage: Day 5

Expression Detail
Antibody Labeling
Phenotype Data

Phenotype Detail
Acknowledgments
This image is the copyrighted work of the attributed author or publisher, and ZFIN has permission only to display this image to its users. Additional permissions should be obtained from the applicable author or publisher of the image.

Reprinted from Developmental Cell, 52(5), Weinberger, M., Simões, F.C., Patient, R., Sauka-Spengler, T., Riley, P.R., Functional Heterogeneity within the Developing Zebrafish Epicardium, 574-590.e6, Copyright (2020) with permission from Elsevier. Full text @ Dev. Cell