
Image
|
Figure Caption
Figure 7
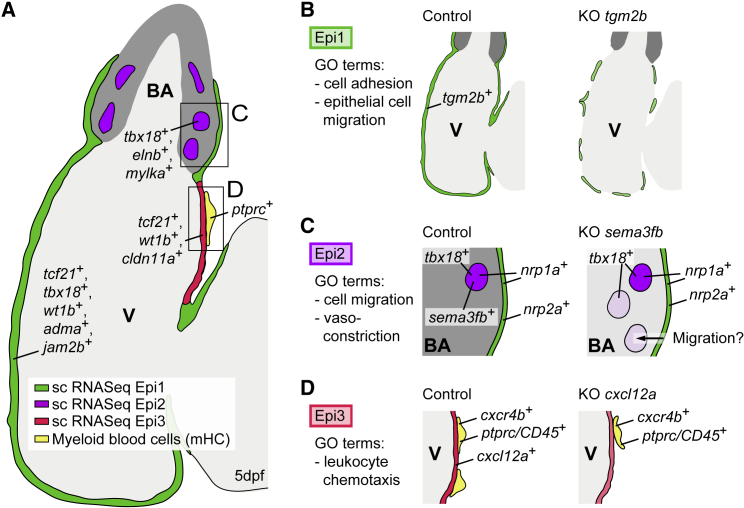
Summary of the Distinct Epicardial Cell Populations in the Developing Zebrafish Heart
(A) Zebrafish heart at 5 dpf, showing the distributions of Epi1-3.
(B) Loss of
(C) Loss of
(D) Loss of
Acknowledgments
This image is the copyrighted work of the attributed author or publisher, and
ZFIN has permission only to display this image to its users.
Additional permissions should be obtained from the applicable author or publisher of the image.
Reprinted from Developmental Cell, 52(5), Weinberger, M., Simões, F.C., Patient, R., Sauka-Spengler, T., Riley, P.R., Functional Heterogeneity within the Developing Zebrafish Epicardium, 574-590.e6, Copyright (2020) with permission from Elsevier. Full text @ Dev. Cell