
|
Figure 2
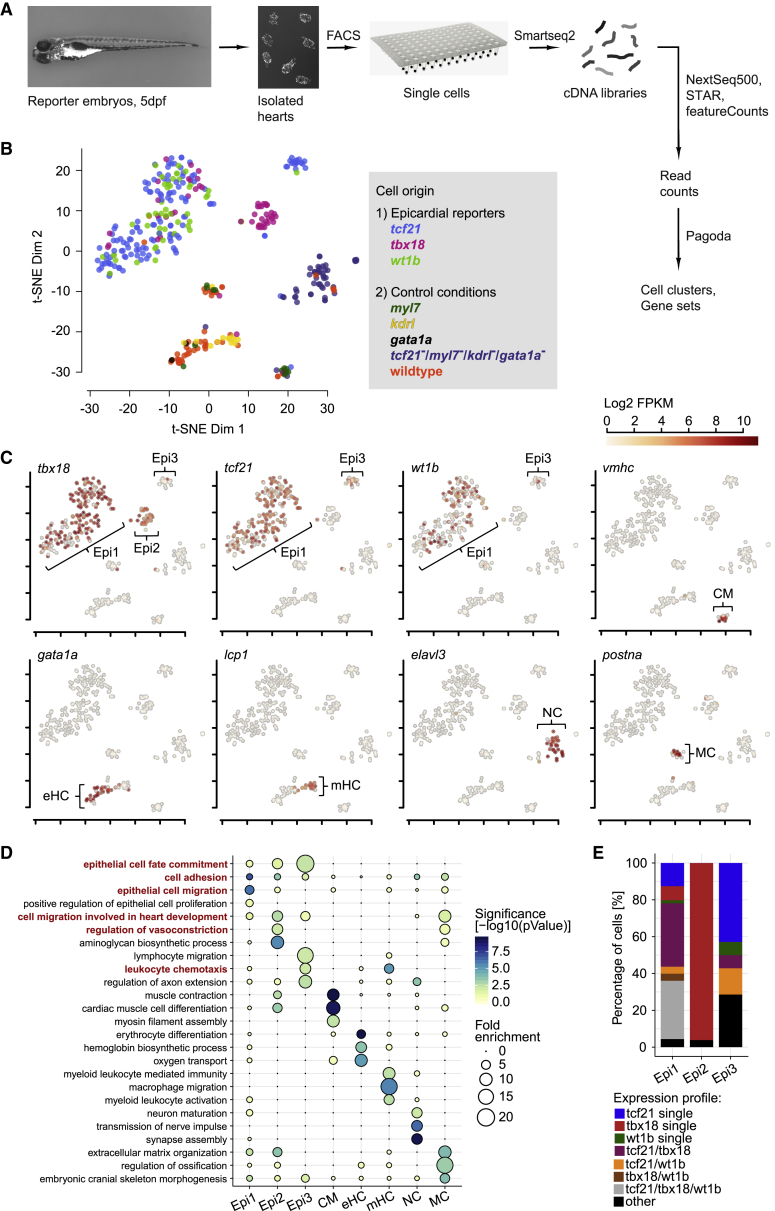
Single-Cell RNA Sequencing Reveals Distinct Epicardial Cell Clusters in the Developing Zebrafish Heart
(A) Overview of the scRNA-seq workflow.
(B) t-distributed stochastic neighbor embedding (t-SNE) clustering of single-cell samples. Colors indicate the reporter or WT line cells were isolated from.
(C) Identification of single-cell clusters based on marker gene expression. Three clusters labeled by
(D) GO term over-representation in the clusters (columns). Bubble size depicts fold enrichment and color scale depicts the statistical significance, with p-values calculated using Fisher’s exact test and Bonferroni correction for multiple hypothesis testing. GO terms important for further analysis are highlighted in red.
(E) Relative quantification of the combinations of
See also
Reprinted from Developmental Cell, 52(5), Weinberger, M., Simões, F.C., Patient, R., Sauka-Spengler, T., Riley, P.R., Functional Heterogeneity within the Developing Zebrafish Epicardium, 574-590.e6, Copyright (2020) with permission from Elsevier. Full text @ Dev. Cell