
- Title
-
A regulatory pathway involving retinoic acid and calcineurin demarcates and maintains joint cells and osteoblasts in the fin regenerate
- Authors
- McMillan, S.C., Zhang, J., Phan, H.E., Jeradi, S., Probst, L., Hammerschmidt, M., Akimenko, M.A.
- Source
- Full text @ Development
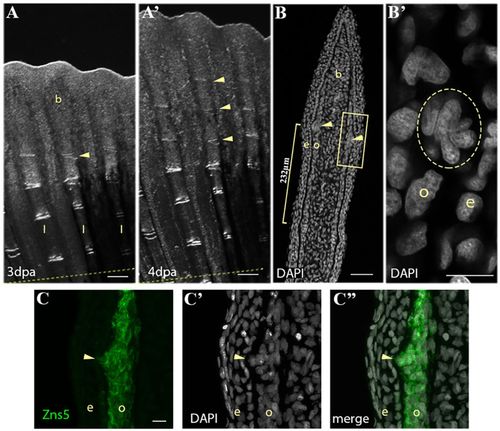
Periodic formation of a cluster of joint-forming cells during fin regeneration. (A-A′) Bright-field images of fin regenerate at 3 dpa (A) and 4 dpa (A′) illustrate the periodic addition of joints (yellow arrowheads) to the distal end of the rays. Dashed yellow line indicates amputation plane. (B) DAPI staining on a 4 dpa regenerate longitudinal cryosection illustrates a cluster of nuclei (yellow arrowheads) 232 μm (yellow bracket) from a mature joint. (B′) Magnification of the boxed area in B showing the nuclei cluster (yellow circle). (C) Zns5 immunohistostaining labels the joint cell cluster and adjacent osteoblasts. (C′) DAPI staining of the same section showing the cell cluster nuclei. (C″) Merged image of C and C′. b, blastema; e, epidermis; l, lepidotrichia; o, osteoblast. Scale bars: 200 μm (A,A′); 50 μm (B); 10 μm (B′; in C for C-C″). EXPRESSION / LABELING:
|
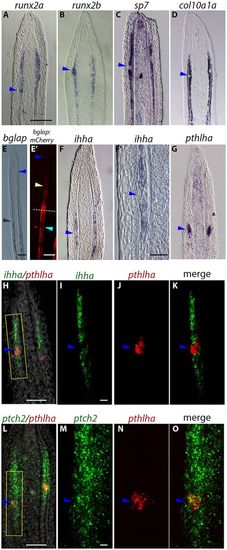
Joint cells and osteoblasts originate from a common cell lineage, but are later committed to different cell fates. All panels show ISH and FISH data for various markers on longitudinal cryosections of 4 dpa fin regenerates except E′, which shows mCherry reporter expression. (A,B) runx2a and runx2b expression domains form a ‘bump’ at the joint-forming cell cluster (blue arrowheads). (C,D) Absence of sp7 (C) and col10a1a (D) expression in the joint cell cluster (blue arrowheads). (E) The distal limit of the domain of expression of the late osteoblast marker bglap (black arrowhead) is proximal to the location of the joint-forming cells (approximate location indicated by blue arrowhead). (E′) mCherry reporter expression in Tg(bglap:mCherry) fish is absent in the distal regenerate (dark blue arrowhead), joints of the regenerate (yellow arrowhead), and mature joints in the stump (light blue arrowhead). Dashed line indicates the amputation plane. (F,F′) ihha is not expressed in the joint-forming cells (blue arrowheads). (G) In contrast, pthlha is expressed in the joint-forming cells (blue arrowhead). (H-O) Double FISH confirms pthlha expression in joint-forming cell clusters (blue arrowheads) that do not express ihha but do express ptch2 (blue arrowheads). I, J and K show magnifications of the boxed area in H. M, N and O show magnifications of the boxed area in L. Scale bars: 100 μm (E; in A for A-D,F,G); 200 μm (E′); 10 μm (F′; in I for I-K; in M for M-O); 50 μm (H,L). EXPRESSION / LABELING:
|
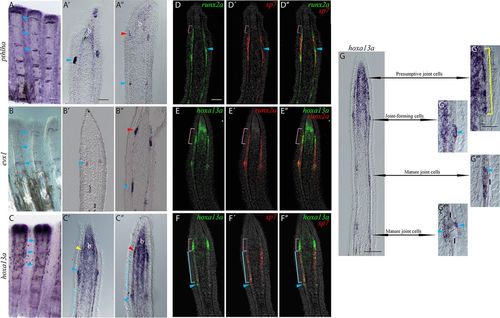
Characterization of the presumptive joint cells. ISH or FISH on whole-mount (A-C) or longitudinal cryosections (A′-G″″) at 4 dpa. A′-C′ and D-D″ show examples of rays without presumptive joint cells as indicated by a distance less than 200 μm between the joint-forming cells (blue arrowheads) and the distal edge of the pre-osteoblasts domain (pink brackets in D-D″). A″-C″ and E-G″″ show examples of rays with presumptive joint cells: the distance between the joint-forming cells (blue arrowheads) and the distal pre-osteoblast domain (pink bracket) is about 254±25 μm. (A-C) pthlha (A), evx1 (B) and hoxa13a (C) are expressed in joint regions. (A′-C′) The three markers are expressed in joint-forming cells and mature joints (blue arrowheads). Yellow arrowhead in C′ indicates pre-osteoblasts that lightly express hoxa13a. (A″-C″) An additional elongated domain of pthlha (A″), evx1 (B″) and hoxa13a (C″) expression (red arrowheads) is observed distal to the joint-forming cells (blue arrowheads) in some rays. hoxa13a is also weakly expressed in newly committed osteoblasts (blue brackets in C′,C″). hoxa13a and pthlha are expressed in the blastema (A-A″,C-C″). (D-D″) A group of runx2a+/sp7− pre-osteoblasts (pink brackets) is present distal to the sp7-expressing committed osteoblasts. (E-E″) Strong hoxa13a expression colocalizes with the distal edge of the runx2a-expressing pre-osteoblasts (pink brackets). (F-F″) Presumptive joint cells (pink brackets) and joint-forming cells (blue arrowheads) that strongly express hoxa13a lack sp7 expression (pink brackets). However, hoxa13a is weakly expressed in newly committed sp7+ osteoblasts (blue brackets). (G) ISH for hoxa13a expression illustrating changes in cell morphology as joints mature. (G′) The presumptive joint cell hoxa13a expression domain possesses an elongated shape (yellow bracket). (G″) The more proximal and mature “joint-forming cells” form a round cluster (blue arrowhead) that is distinct from osteoblasts. (G‴-G″″) hoxa13a expression persists in mature joint cells, which are located first on the internal side (G‴), then on both internal and external sides (G″″) of the lepidotrichia (blue arrowheads). b, blastema; l, lepidotrichia. Scale bars: 200 μm (in A for A-C); 50 μm (in A′ for A′-C″); 50 μm (in D for D-F); 100 μm (G); 30 μm (in G′ for G′-G″″). EXPRESSION / LABELING:
|
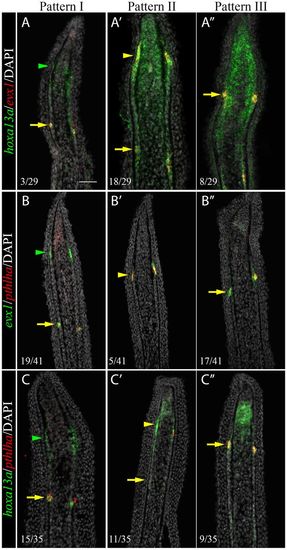
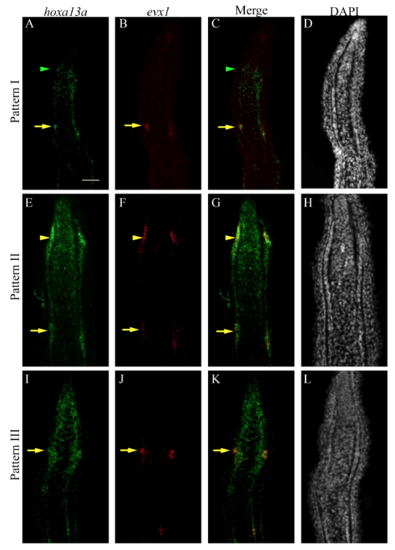
Sequential activation of hoxa13a, evx1 and pthlha expression in the presumptive joint cells. Double FISH and DAPI counterstains on longitudinal cryosections of 4 dpa fin regenerates illustrate three distinct patterns of expression. (A-C′) Patterns I and II are observed in rays with presumptive joint cells (arrowheads). (A″-C″) Pattern III is observed in rays without presumptive joint cells. (A-C″) In joint-forming cells (yellow arrows), the three markers are co-expressed in the joint-forming cells. (A,A′,C,C′) In the presumptive joint cells (green or yellow arrowheads), hoxa13a is expressed alone (Pattern I, A,C) or co-expressed with evx1 (Pattern II, A′) or pthlha (Pattern II, C′). (B′,C′) pthlha is also co-expressed with evx1 (B′). (B,B′) evx1 is either expressed alone (B) or co-expressed with pthlha (B′). Numbers in each panel represent the number of sections with the expression pattern over the total number of sections analyzed. Scale bar: 50 μm (in A for A-C″). EXPRESSION / LABELING:
|
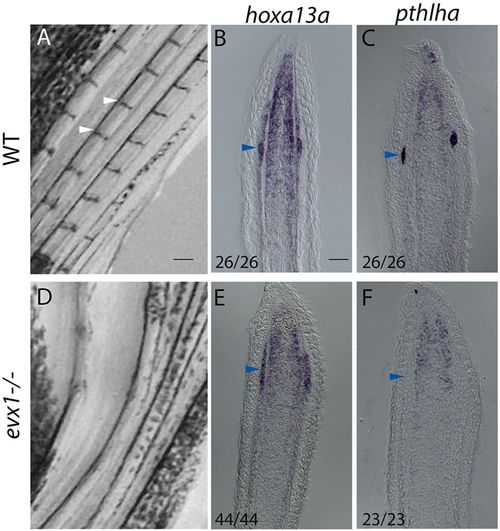
In evx1−/− loss-of-function mutants, expression of hoxa13a but not pthlha persists in presumptive joint cells. (A) Wild-type fins possess joints (white arrowheads). (B,C) ISH on longitudinal cryosections of 4 dpa wild-type regenerates reveals hoxa13a (B) and pthlha (C) expression in joint cells (blue arrowheads). (D) In evx1−/− mutants joints are lost. (E,F) Longitudinal cryosections of 4 dpa evx1−/− mutant regenerates indicate hoxa13a (E) is expressed in presumptive joint cells but pthlha is not (F). Numbers in each panel represent the number of sections with the expression pattern over the total number of sections analyzed. Scale bars: 200 μm (in A for A,D); 50 μm (in B for B,C,E,F). |
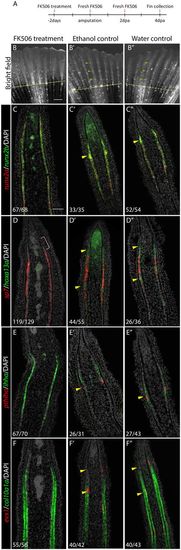
Inhibition of calcineurin activity suppresses joint formation and joint-related gene expression. (A) Fish were treated with FK506 for 2 days prior to amputation. At 0 dpa/2 dot, fins were amputated and treatments continued for 4 days. (B) At 4 dpa/6 dot, no joints form in the regenerates of FK506-treated fish. (B′,B″) Ethanol (B′) and water (B″) controls form joints normally in the regenerate (yellow arrowheads). Dashed yellow lines indicate amputation plane. (C-F″) Double FISH on longitudinal cryosections of 4 dpa regenerates. (C) In FK506-treated fins, runx2a and runx2b are expressed, but joint cell clusters are absent (no ‘bump’ in the expression domain). (D-F) FK506 treatment inhibits hoxa13a (D), pthlha (E) and evx1 (F) expression. sp7 (D), ihha (E) and col10a1 (F) domains of expression are uninterrupted in committed osteoblasts owing to the absence of joints. However, sp7 is still absent in the distal pre-osteoblasts (D, pink bracket). (C′-F″) Expression of joint (yellow arrowheads) and osteoblast markers are unaffected in ethanol (C′-F′) and water (C″-F″) controls. Numbers in each panel represent the number of sections with the expression pattern over the total number of sections analyzed. Scale bars: 500 μm (in B for B-B″); 50 μm (in C for C-F″). |
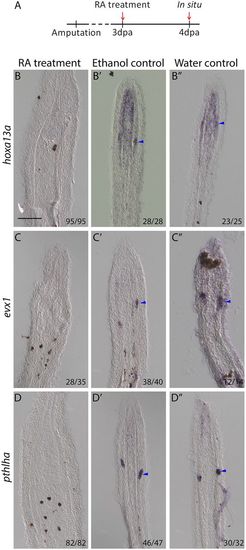
RA treatment leads to the inhibition of joint cell marker expression. (A) Fish were treated with RA from 3 to 4 dpa. (B-D) ISH on longitudinal cryosections at 4 dpa/1 dot indicate hoxa13a (B), evx1 (C) and pthlha (D) expression are lost in joint cells of RA-treated fish. (B′-D″) Expression remains in joint cells (blue arrowheads) of ethanol (B′-D′) and water (B″-D″) controls. Numbers in each panel represent the number of sections with the expression pattern over the total number of sections analyzed. Scale bar: 100 μm (in B for B-D″). EXPRESSION / LABELING:
|
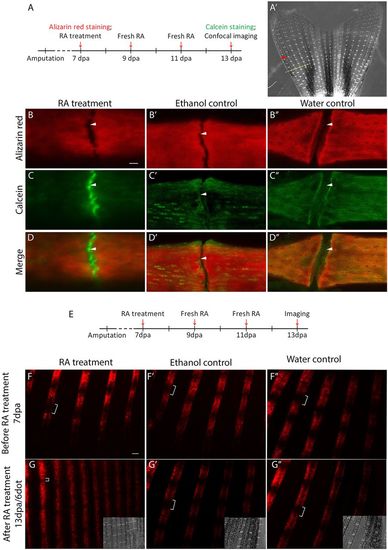
RA treatment leads to bone matrix deposition between bone segments. (A) Fish with regenerating fins (7 dpa) were stained with Alizarin Red, and then treated with RA for 6 days. At 6 dot/13 dpa, fins were stained with calcein. (A′) The first joint proximal to the first bifurcation on the second most dorsal fin ray was analyzed (red arrowhead). Yellow dashed line indicates amputation plane. (B-B″) Alizarin Red staining alone shows no difference between RA-treated and control joints (white arrowheads). (C) Calcein staining indicates new bone matrix being deposited within joint spaces (white arrowhead) following RA treatment. (C′,C″) No new bone is observed in ethanol (C′) and water (C″) controls (white arrowheads). (D′-D″) Merged images of Alizarin Red and calcein staining. (E) Tg(bglap:mCherry) fish at 7 dpa were treated with RA for 6 days and imaged. (F-F″) At 0 dot/7 dpa (before RA treatment), mature osteoblasts are not observed in joint regions of fin regenerates (white brackets). (G) At 6 dot/13 dpa, a decrease in gap size (white brackets) is observed in RA-treated fish compared with ethanol (G′) and water (G″) controls. Insets in G-G″ are bright-field images to show the ray joints. Scale bars: 10 μm (in B for B-D″); 100 μm (in F for F-G″). |
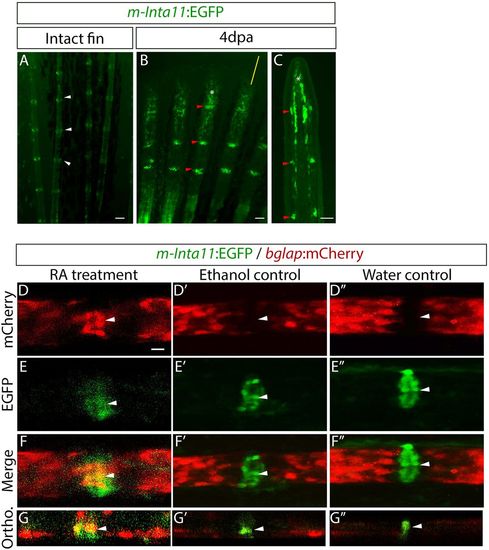
RA treatment leads to the differentiation of joint cells to mature osteoblasts. (A-C) Tg(m-Inta11-EGFP) GFP reporter expression in the intact fin (A) and 4 dpa regenerate (B,C). (A) Whole-mount intact fins illustrate that EGFP is expressed faintly in osteoblasts and strongly in joint cells (white arrowheads). (B,C) Whole-mount (B) and longitudinal sections (C) of regenerating fins show EGFP expression in joint cells (red arrowheads) and in osteoblasts and the blastema (white asterisks). Yellow line in B indicates the position of the section shown in C. (D-G) Confocal images of RA-treated Tg(m-Inta11:EGFP; bglap:mCherry) fin regenerates at 3 dot illustrates that EGFP-expressing joint cells begin to express mCherry (white arrowheads). (D′-F″) Ethanol (D′-F′) and water (D″-F″) controls indicate that EGFP-positive joint cells do not express mCherry (white arrowheads). (G-G″) Orthogonal view through the fin ray showing co-expression of EGFP and mCherry in joint cells (white arrowheads). Scale bars: 50 μm (A-C); 10 μm (in D for D-F″). |
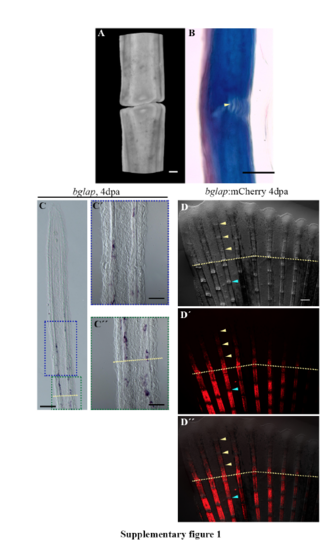
Joint Structure. (A) Confocal 3D rendering of two fin ray segments separated by a joint. (B) Mallory staining illustrating two bone segments are connected by ligaments (yellow arrowhead). (C-C”) ISH on longitudinal cryosections of 4dpa fin regenerates illustrate bglap expression in the proximal fin regenerate and stump osteoblasts. (C’) Magnification of the proximal fin regenerate (blue box in C). (C”) Magnification of the proximal fin regenerate and stump (green box in C). (D-D”) Tg(bglap:mCherry) 4dpa regenerates illustrate mCherry expression in mature osteoblasts but not in joint regions in the fin regenerate (yellow arrowheads) and stump (blue arrowheads). (D) Brightfield only. (D’) mCherry only. (D”) merged. Amputation planes = dashed yellow line. Scale bars A=10μm, B=10μm, C=100μm, C’=50μm, C”=50μm, D-D’’=200μm (shown in D). |
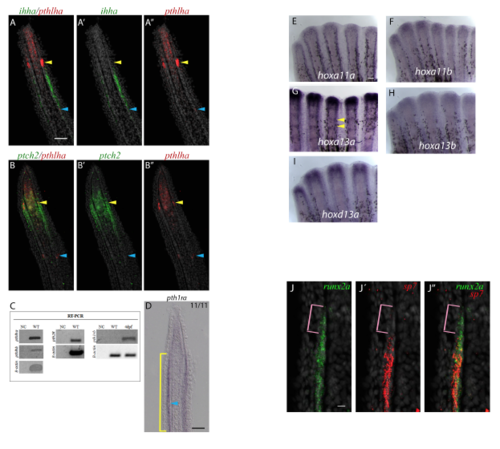
Gene expression analysis of hox genes, pthlha, ihha, pth1rb and ptch-2 at 4dpa. (AA”) pthlha is expressed at the level of joints (blue and yellow arrowheads in A-A” and B-B”) while ihha is only found in osteoblasts (A-A”). (B-B”) ptch2 is expressed in joint cells (yellow arrowheads) and differentiating osteoblasts, but not mature joints (blue arrowheads). (C) RTPCR indicates pthlha, pthlhb, and pth2r are expressed in the 4dpa fin regenerates. pth1rb is not expressed in 4dpa wildtype fin regenerates, but is expressed in 4 days post fertilization (dpf) larvae. β-actin was used as the housekeeping control. NC = Negative Control. WT = wildtype. (D) In 11/11 sections, pth1ra is faintly expressed in differentiating osteoblasts (yellow bracket) and joint-forming cells (blue arrowhead). (E-I) ISH on whole mount fin regenerates indicate only hoxa13a is strongly expressed in joint regions (yellow arrowheads). Although faint staining appears in joints for hoxa13b (H) and hoxd13a (I), it is likely background as 4dpa fin regenerate sections do not show expression. (J-J”) Magnified images from Fig. 3D-D” to further illustrate the absence of sp7 expression in the most distal runx2a expression domain (pink brackets). Scale bar A-B” = 50μm (shown in A), J-J’’=10μm (shown in J); D =50μm, E-I =100μm (shown in E). EXPRESSION / LABELING:
|
Relative expression patterns of hoxa13a and evx1. (A-L) Double FISH (A-C, E-G, IK) and DAPI counterstains (D, H, L) on longitudinal cryosections of 4dpa fin regenerates. (A-C, E-G, I-K) In joint-forming cells, evx1 and hoxa13a are always co-expressed (yellow arrows). (AH) In presumptive joint cells, hoxa13a is expressed either alone (Pattern I: A-D, green arrowheads) or is co-expressed with evx1 (Pattern II: E-H, yellow arrowheads). (I-K) In Pattern III: hoxa13a and evx1 are co-expressed in joint-forming cells when presumptive joint cells are not present (yellow arrows). (A, E, I) hoxa13a alone. (B, F, J) evx1 alone. (C, G, K) hoxa13a and evx1 expression merged. Scale Bars = 50μm (shown in A). These images are single image views for the merged images in Fig.4A-A”. |
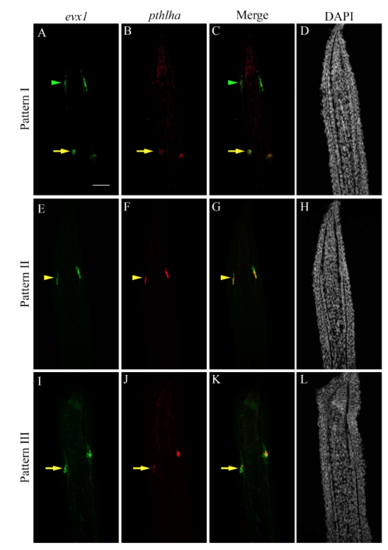
Relative expression patterns of evx1 and pthlha. (A-L) Double FISH (A-C, E-G, I-K) and DAPI counterstains (D, H, L) on longitudinal cryosections of 4dpa fin regenerates. (A-C, IK) In joint-forming cells, evx1 and pthlha are always co-expressed (yellow arrows). In presumptive joint cells, evx1 is expressed either alone (Pattern I: A-D, green arrowheads) or is co-expressed with pthlha (Pattern II: E-H, yellow arrowheads). (I-L) In Pattern III: evx1 and pthlha are expressed in joint-forming cells when presumptive cells are not yet present (yellow arrows). (A, E, I) evx1 expression alone. (B, F, J) pthlha expression alone. (C, G, K) evx1 and pthlha expression merged images. Scale Bars = 50μm (shown in A). These images are single image views for the merged images in Fig.4B-B”. |
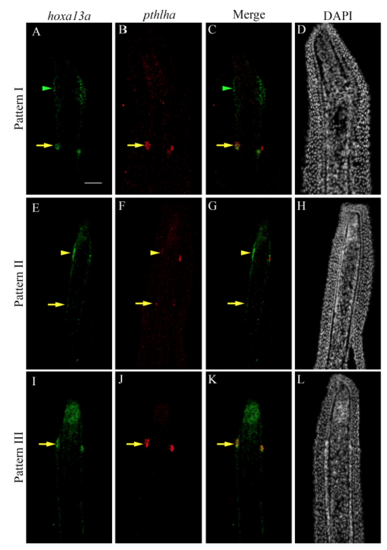
Relative expression patterns of hoxa13a and pthlha. (A-L) Double FISH (A-C, E-G, I-K) and DAPI counterstains (D, H, L) on longitudinal cryosections of 4 dpa fin regenerates. (AC, E-G, I-K) In joint-forming cells, hoxa13a and pthlha are always co-expressed (yellow arrows). In presumptive joint cells, hoxa13a is expressed either alone (Pattern I: A-D, green arrowheads) or is co-expressed with pthlha (Pattern II: E-H, yellow arrowheads). (I-L) In Pattern III: hoxa13a and pthlha are expressed in joint-forming cells when presumptive cells are not yet present (yellow arrows). (A, E, I) hoxa13a expression alone. (B, F, J) pthlha expression alone. (C, G, K) hoxa13a and pthlha expression merged. Scale Bars = 50μm (shown in A). These images are single image views for the merged images in Fig.4C-C”. |
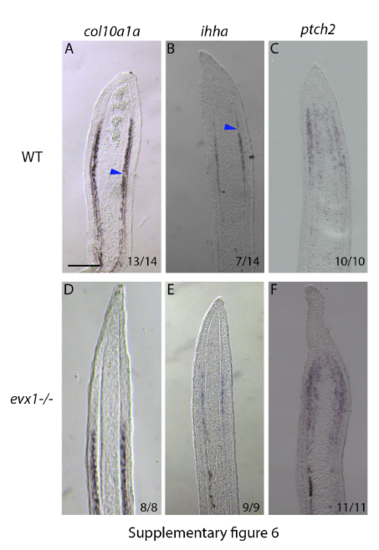
Gene expression analyses in wildtype and evx1-/- loss of function mutants. In wildtype longitudinal cryosections col10a1a (A) and ihha (B) are expressed in osteoblasts with gaps corresponding to joint cells (blue arrowheads). There is no change in ptch2 expression between wildtype (C) and evx1-/- mutants (F). However, in evx1-/- mutants, col10a1a (D) and ihha (E) are expressed in a continuous pattern without the gaps corresponding to the position of joints. Scale bars for all panels = 100μm (shown in A). Numbers in each panel represent the number of sections with the expression pattern over the total number of sections analyzed. |
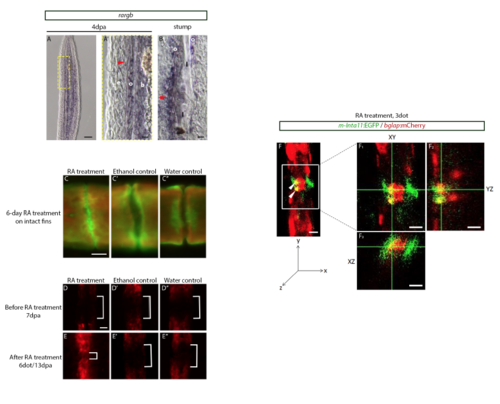
Retinoic Acid Treatment leads to bone deposition and osteoblast encroachment in joint regions. (A) ISH on 4dpa fin regenerates indicating rargb is expressed in osteoblasts and blastema of the 4dpa fin regenerate. (A’) Magnified image from the yellow box in A indicating rargb is expressed in osteoblasts, blastema, and joint-forming cells (red arrowhead). (B) rargb is also expressed in mature joint cells (red arrowhead) surrounding the lepidotrichia. (C) Calcein (green) and alizarin red (red) stains illustrate that 6dot with RA results in new bone deposition (green) in joints of intact fins when compared to ethanol (C’) and water (C”) controls. (D-D”) Prior to RA treatment, Tg(bglap:mCherry) fin regenerates do not possess mCherry expressing osteoblasts in joint regions (white brackets). (E) 13dpa/6dot with RA: mCherry-expressing osteoblasts are observed in the joints (white bracket). No mCherry-expressing osteoblasts are in joint regions in ethanol (E’, D’) and water (E”, D”) controls (white brackets). (F) Confocal image of Tg(m-Inta11:EGFP; bglap:mCherry) following 3 dot with RA. Image of the XY (F1), YZ (F2), and XZ (F3) planes illustrating a joint cell co-expressing EGFP and mCherry (yellow). osteoblasts (o), blastema (b), lepidotrichia (l), basal epidermis (e). Scale Bars: A=50μm; A’- B=10μm; C-C’’=10μm (shown in C); D-E’’=50μm (shown in D); F-F3=20μm. EXPRESSION / LABELING:
|