
|
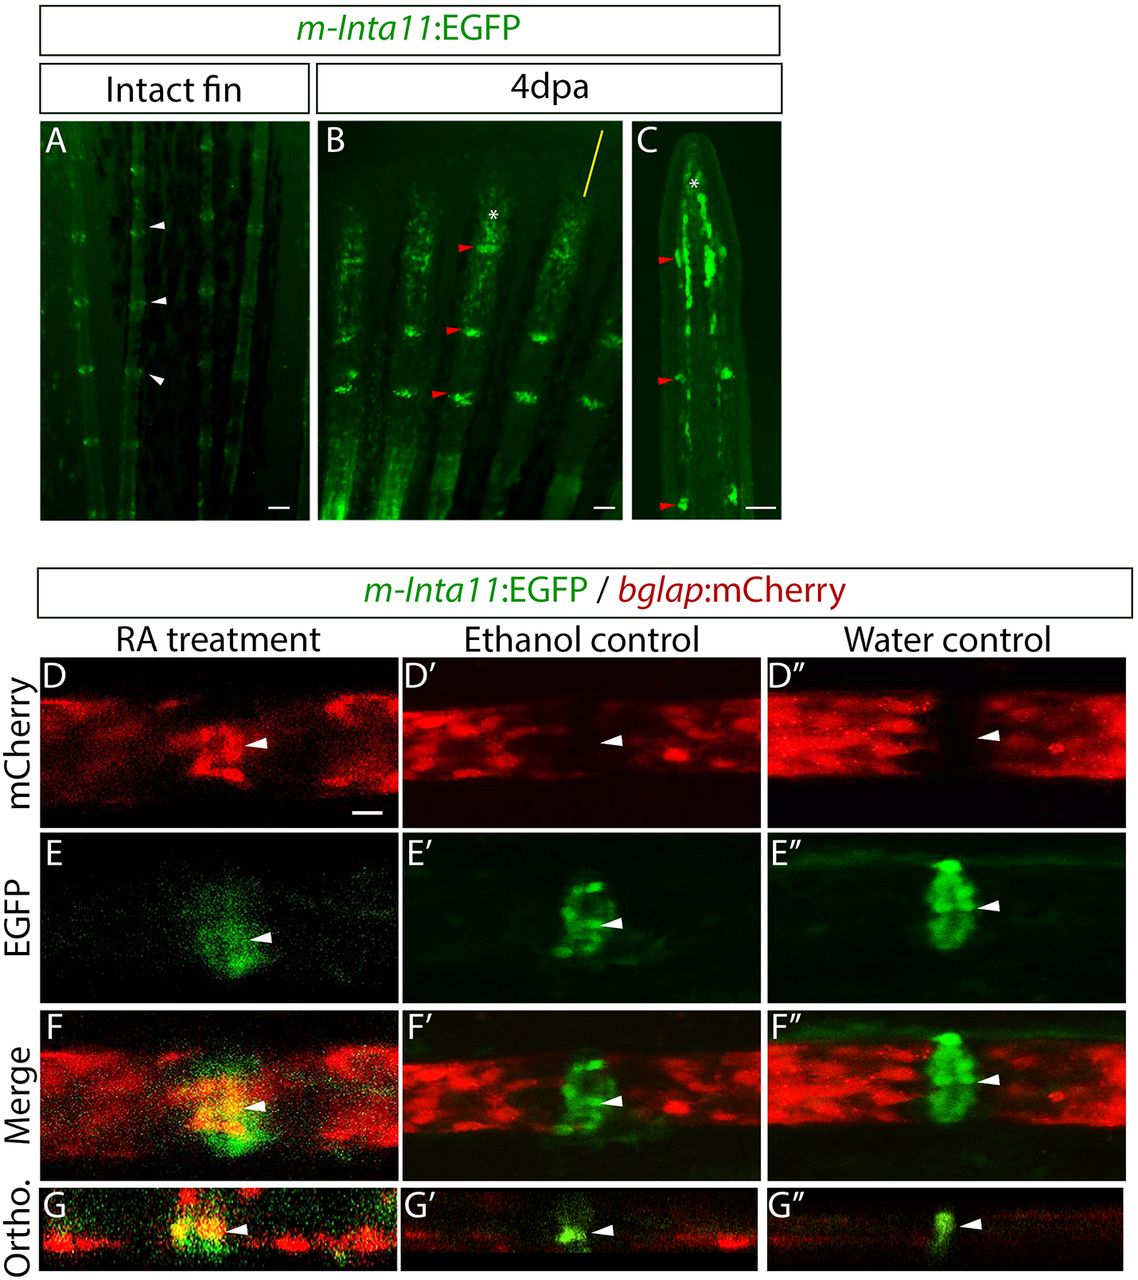
Fig. 9
RA treatment leads to the differentiation of joint cells to mature osteoblasts. (A-C) Tg(m-Inta11-EGFP) GFP reporter expression in the intact fin (A) and 4 dpa regenerate (B,C). (A) Whole-mount intact fins illustrate that EGFP is expressed faintly in osteoblasts and strongly in joint cells (white arrowheads). (B,C) Whole-mount (B) and longitudinal sections (C) of regenerating fins show EGFP expression in joint cells (red arrowheads) and in osteoblasts and the blastema (white asterisks). Yellow line in B indicates the position of the section shown in C. (D-G) Confocal images of RA-treated Tg(m-Inta11:EGFP; bglap:mCherry) fin regenerates at 3 dot illustrates that EGFP-expressing joint cells begin to express mCherry (white arrowheads). (D′-F″) Ethanol (D′-F′) and water (D″-F″) controls indicate that EGFP-positive joint cells do not express mCherry (white arrowheads). (G-G″) Orthogonal view through the fin ray showing co-expression of EGFP and mCherry in joint cells (white arrowheads). Scale bars: 50 μm (A-C); 10 μm (in D for D-F″).