
|
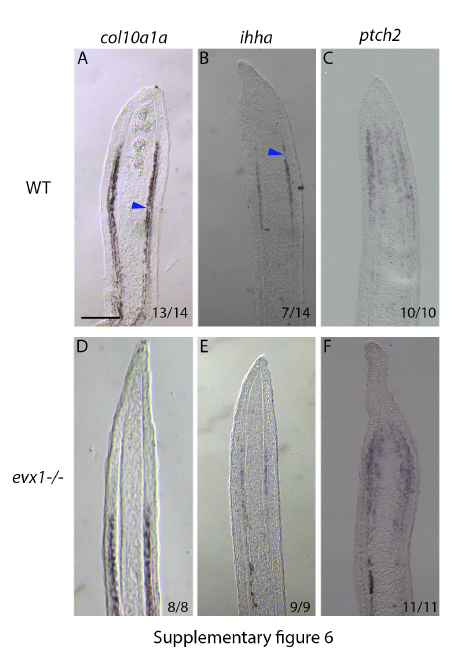
Fig. S6
Gene expression analyses in wildtype and evx1-/- loss of function mutants. In wildtype longitudinal cryosections col10a1a (A) and ihha (B) are expressed in osteoblasts with gaps corresponding to joint cells (blue arrowheads). There is no change in ptch2 expression between wildtype (C) and evx1-/- mutants (F). However, in evx1-/- mutants, col10a1a (D) and ihha (E) are expressed in a continuous pattern without the gaps corresponding to the position of joints. Scale bars for all panels = 100μm (shown in A). Numbers in each panel represent the number of sections with the expression pattern over the total number of sections analyzed.