
|
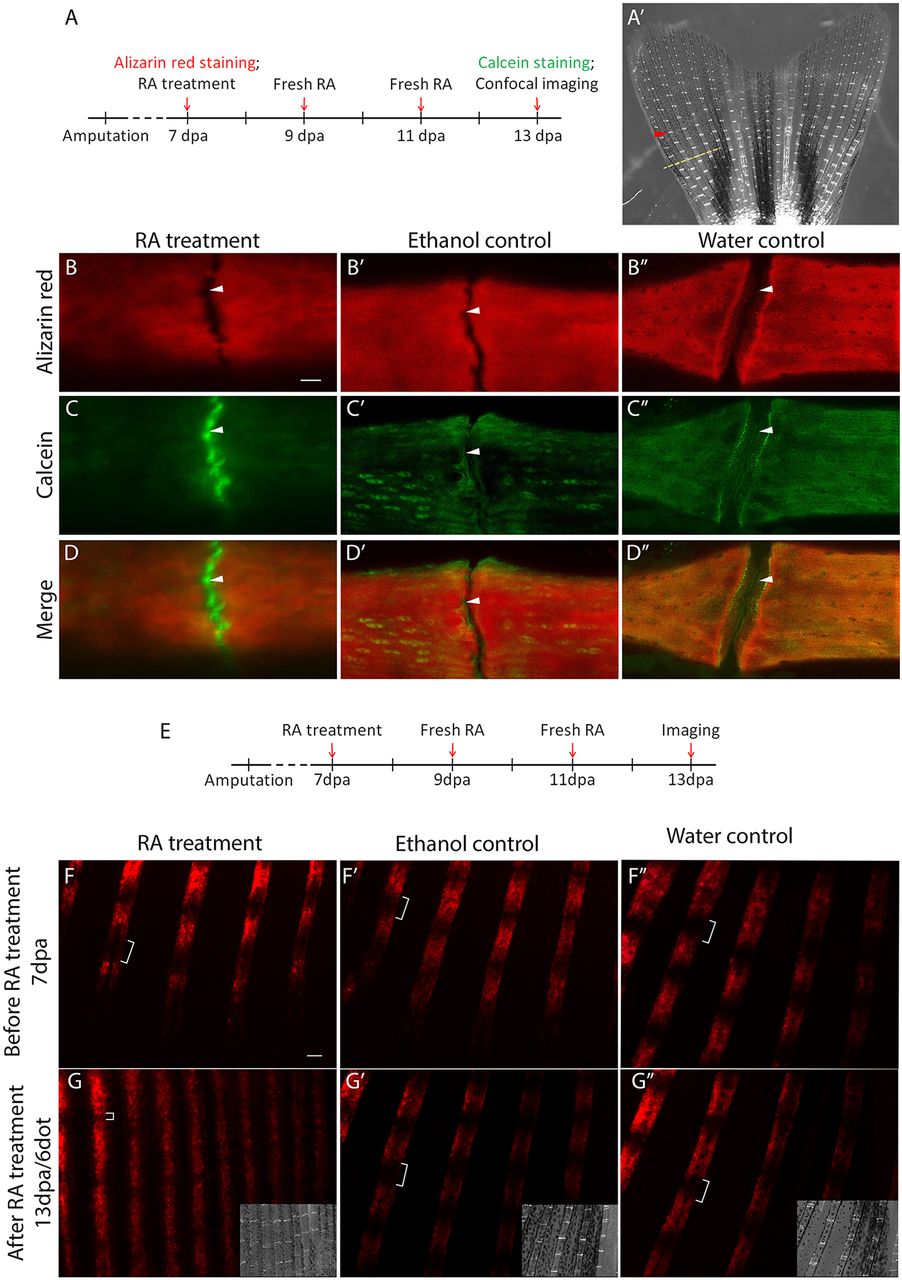
Fig. 8
RA treatment leads to bone matrix deposition between bone segments. (A) Fish with regenerating fins (7 dpa) were stained with Alizarin Red, and then treated with RA for 6 days. At 6 dot/13 dpa, fins were stained with calcein. (A′) The first joint proximal to the first bifurcation on the second most dorsal fin ray was analyzed (red arrowhead). Yellow dashed line indicates amputation plane. (B-B″) Alizarin Red staining alone shows no difference between RA-treated and control joints (white arrowheads). (C) Calcein staining indicates new bone matrix being deposited within joint spaces (white arrowhead) following RA treatment. (C′,C″) No new bone is observed in ethanol (C′) and water (C″) controls (white arrowheads). (D′-D″) Merged images of Alizarin Red and calcein staining. (E) Tg(bglap:mCherry) fish at 7 dpa were treated with RA for 6 days and imaged. (F-F″) At 0 dot/7 dpa (before RA treatment), mature osteoblasts are not observed in joint regions of fin regenerates (white brackets). (G) At 6 dot/13 dpa, a decrease in gap size (white brackets) is observed in RA-treated fish compared with ethanol (G′) and water (G″) controls. Insets in G-G″ are bright-field images to show the ray joints. Scale bars: 10 μm (in B for B-D″); 100 μm (in F for F-G″).