
|
Fig. S2
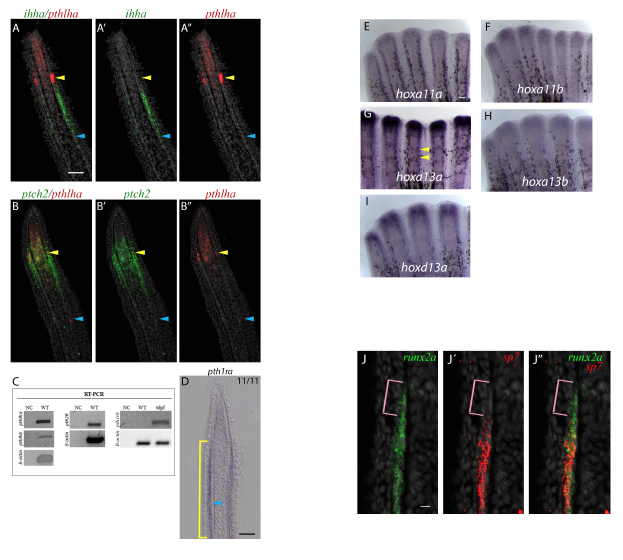
Gene expression analysis of hox genes, pthlha, ihha, pth1rb and ptch-2 at 4dpa. (AA”) pthlha is expressed at the level of joints (blue and yellow arrowheads in A-A” and B-B”) while ihha is only found in osteoblasts (A-A”). (B-B”) ptch2 is expressed in joint cells (yellow arrowheads) and differentiating osteoblasts, but not mature joints (blue arrowheads). (C) RTPCR indicates pthlha, pthlhb, and pth2r are expressed in the 4dpa fin regenerates. pth1rb is not expressed in 4dpa wildtype fin regenerates, but is expressed in 4 days post fertilization (dpf) larvae. β-actin was used as the housekeeping control. NC = Negative Control. WT = wildtype. (D) In 11/11 sections, pth1ra is faintly expressed in differentiating osteoblasts (yellow bracket) and joint-forming cells (blue arrowhead). (E-I) ISH on whole mount fin regenerates indicate only hoxa13a is strongly expressed in joint regions (yellow arrowheads). Although faint staining appears in joints for hoxa13b (H) and hoxd13a (I), it is likely background as 4dpa fin regenerate sections do not show expression. (J-J”) Magnified images from Fig. 3D-D” to further illustrate the absence of sp7 expression in the most distal runx2a expression domain (pink brackets). Scale bar A-B” = 50μm (shown in A), J-J’’=10μm (shown in J); D =50μm, E-I =100μm (shown in E).