
|
Fig. S7
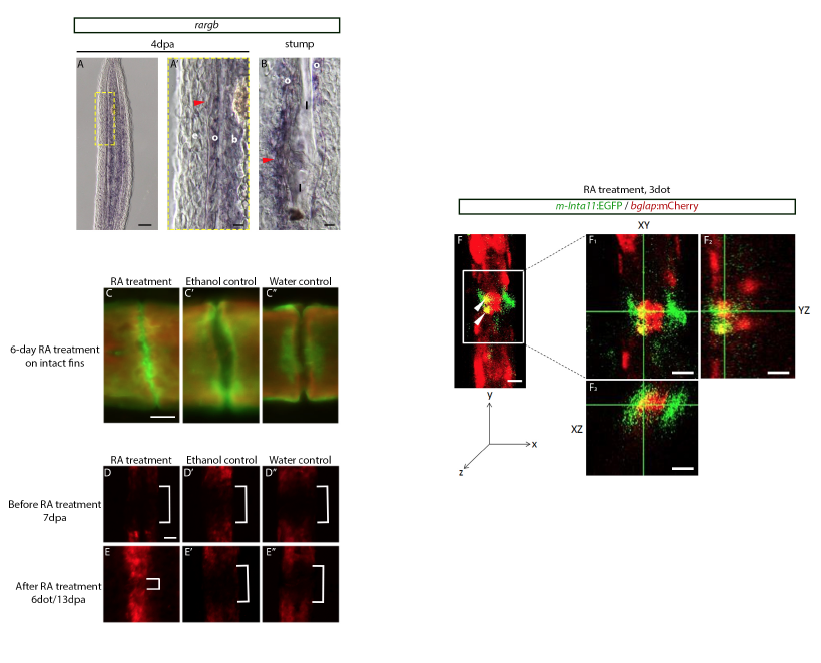
Retinoic Acid Treatment leads to bone deposition and osteoblast encroachment in joint regions. (A) ISH on 4dpa fin regenerates indicating rargb is expressed in osteoblasts and blastema of the 4dpa fin regenerate. (A’) Magnified image from the yellow box in A indicating rargb is expressed in osteoblasts, blastema, and joint-forming cells (red arrowhead). (B) rargb is also expressed in mature joint cells (red arrowhead) surrounding the lepidotrichia. (C) Calcein (green) and alizarin red (red) stains illustrate that 6dot with RA results in new bone deposition (green) in joints of intact fins when compared to ethanol (C’) and water (C”) controls. (D-D”) Prior to RA treatment, Tg(bglap:mCherry) fin regenerates do not possess mCherry expressing osteoblasts in joint regions (white brackets). (E) 13dpa/6dot with RA: mCherry-expressing osteoblasts are observed in the joints (white bracket). No mCherry-expressing osteoblasts are in joint regions in ethanol (E’, D’) and water (E”, D”) controls (white brackets). (F) Confocal image of Tg(m-Inta11:EGFP; bglap:mCherry) following 3 dot with RA. Image of the XY (F1), YZ (F2), and XZ (F3) planes illustrating a joint cell co-expressing EGFP and mCherry (yellow). osteoblasts (o), blastema (b), lepidotrichia (l), basal epidermis (e). Scale Bars: A=50μm; A’- B=10μm; C-C’’=10μm (shown in C); D-E’’=50μm (shown in D); F-F3=20μm.