
|
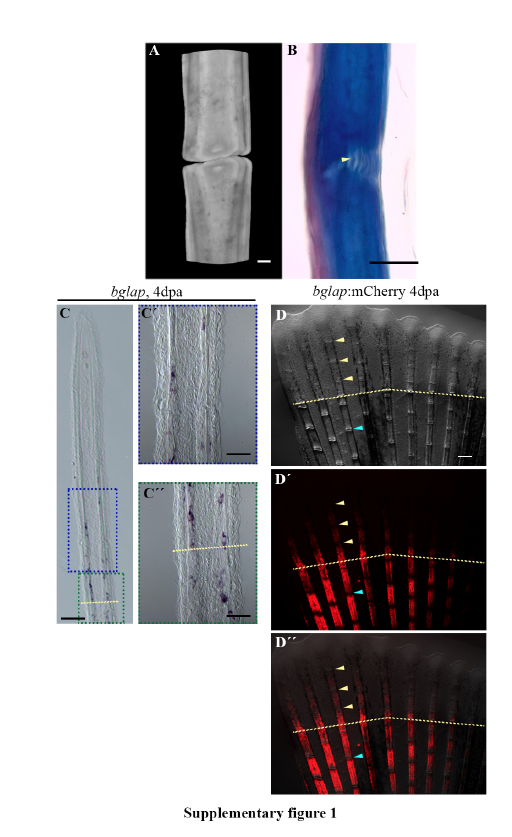
Fig. S1
Joint Structure. (A) Confocal 3D rendering of two fin ray segments separated by a joint. (B) Mallory staining illustrating two bone segments are connected by ligaments (yellow arrowhead). (C-C”) ISH on longitudinal cryosections of 4dpa fin regenerates illustrate bglap expression in the proximal fin regenerate and stump osteoblasts. (C’) Magnification of the proximal fin regenerate (blue box in C). (C”) Magnification of the proximal fin regenerate and stump (green box in C). (D-D”) Tg(bglap:mCherry) 4dpa regenerates illustrate mCherry expression in mature osteoblasts but not in joint regions in the fin regenerate (yellow arrowheads) and stump (blue arrowheads). (D) Brightfield only. (D’) mCherry only. (D”) merged. Amputation planes = dashed yellow line. Scale bars A=10μm, B=10μm, C=100μm, C’=50μm, C”=50μm, D-D’’=200μm (shown in D).