
- Title
-
Sema3d controls collective endothelial cell migration by distinct mechanisms via Nrp1 and PlxnD1
- Authors
- Hamm, M.J., Kirchmaier, B.C., Herzog, W.
- Source
- Full text @ J. Cell Biol.
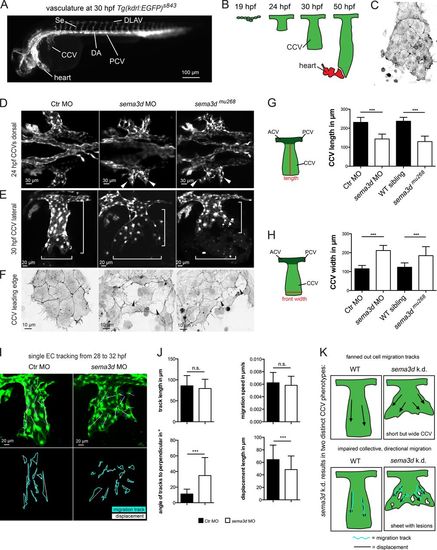
Sema3d regulates collective EC migration by controlling CCV width and EC sheet organization. (A) Vasculature of a 30-hpf-old zebrafish embryo visualized by GFP expression of Tg(kdrl:EGFP)s843. (B) Illustration of CCV development. (C) CCV ECs migrate as a collective cell sheet; F-Actin visualized by GFP expression of Tg(fli1a:lifeactEGFP)mu240 at 32 hpf. (D–F) CCV development is impaired in sema3d morphants and mutants. (D) Widened CCV outgrowth upon Sema3d loss at 24 hpf (white arrowheads); confocal projections of Tg(kdrl:EGFP)s843 embryos. (E) Shorter but wider CCVs of sema3d morphants and mutants at 30 hpf (white brackets). (F) The CCV cell sheet exhibits lesions (black arrowheads) in the leading edges of 30-hpf Sema3d-deficient Tg(fli1a:lifeactEGFP)mu240 embryos. Confocal projections were color-inverted. (G) Quantification of CCV length shows a shortening in sema3d morphants and mutants at 30 hpf (each n = 25). (H) Quantification of CCV front width shows an increase in sema3d morphants and mutants at 30 hpf (each n = 18). (I and J) Tracking of single CCV EC migration from 28 to 32 hpf. (I) Confocal projections at 32 hpf with migration tracks (turquoise lines) and displacement distance (white arrows). (J) Quantification of migration parameters (each condition 84 cells and 14 cells per embryo/movie). Track length and migration speed are not impaired in sema3d morphants. In contrast, track displacement length is reduced and the angles of tracks to the perpendicular are increased in sema3d morphants compared with Ctr morphants, leading to a fanned-out CCV. (K) Model of sema3d knockdown (k.d.) representing the two distinct phenotypes: first, fanned-out cell migration tracks leading to a shorter but wider CCV; second, impaired collective and directional migration and a disrupted EC sheet. DA, dorsal aorta; ACV, anterior cardinal vein; PCV, posterior cardinal vein. ***, P < 0.001; n.s., not significant. Error bars indicate SD. |
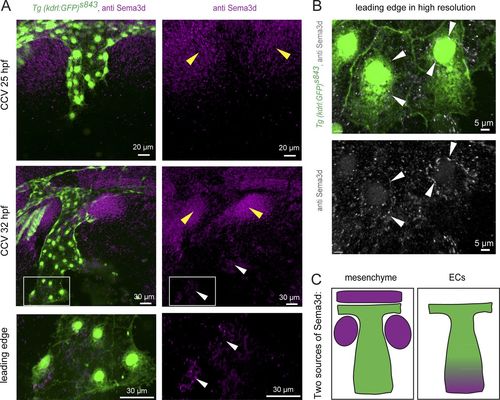
Sema3d is localized in the mesenchyme next to the CCV and in the ECs of the CCV leading edge. (A) Lateral confocal projections of Tg(kdrl:EGFP)s843 embryos at 25 and 32 hpf stained for Sema3d protein expression. Sema3d is localized in the mesenchyme next to the CCV (yellow arrowheads). At 32 hpf, Sema3d is additionally expressed in the CCV leading edge (white arrowheads). Magnification of the leading edge reveals expression in ECs. (B) Higher-resolution imaging localizes Sema3d expression inside the leading edge ECs at 30 hpf (white arrowheads). (C) Model of the two Sema3d expression domains (magenta, Sema3d; green, ECs). |
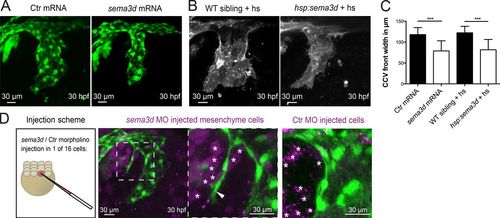
Mesenchymal Sema3d acts as a repulsive cue for CCV outgrowth. (A–C) Global sema3d overexpression reduces CCV width. (A) sema3d mRNA–injected Tg(kdrl:EGFP)s843 embryos exhibit reduced CCV width at 30 hpf. (B) sema3d expression was induced by consecutive heat shocks (hs) at 16 and 19 hpf (each for 1 h at 39°C) in Tg(hsp70:sema3dGFP), Tg(kdrl:HRAS-mCherry)s896 embryos. sema3d-overexpressing embryos show a thinner CCV at 30 hpf. (C) Quantification of CCV front width (each n = 18). Error bars indicate SD. (D) Mosaic sema3d k.d. through sema3d MO injection into one of 16 cells in Tg(kdrl:EGFP)s843 embryos (magenta, coinjection with DiI for cell tracking). Partial loss of sema3d in the mesenchyme (white asterisks) induced ECs (white arrowhead) to migrate into the mesenchyme (n = 3), indicating that sema3d acts as a repulsive cue in the mesenchyme next to the CCV. Ctr MO-injected mesenchymal cells (white asterisks in right panel) did not induce ectopic EC migration. ***, P < 0.001. |
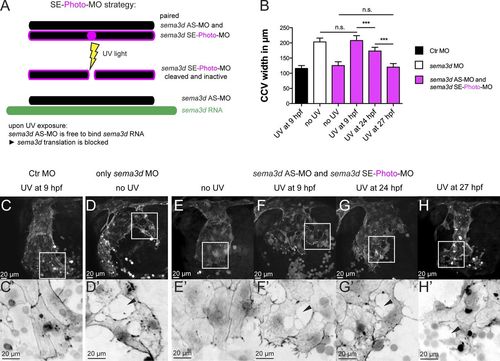
EC-specific Sema3d acts independently of mesenchymal Sema3d and is required for EC sheet organization and collective migration. Time-specific sema3d knockdown with photo-MOs suggests that EC-specific Sema3d is capable of preserving a cohesive EC sheet. (A) SE-photo-MO strategy for time-specific sema3d knockdown consists of the sema3d AS-MO, paired to a UV light–cleavable sema3d SE-photo-MO (together called AS+SE-photo-MO). UV light induces cleavage of the sema3d SE-photo-MO, enabling the sema3d AS-MO to bind sema3d mRNA and block translation at a chosen time point. (B–H′) Tg(fli1a:lifeactEGFP)mu240 embryos injected with Ctr MO (C), sema3d MO (D), or AS+SE-photo-MO (E–H) were exposed to UV light at the indicated time points and analyzed at 30 hpf. (B) Quantification of CCV front width (each n = 10). ***, P < 0.001; n.s., not significant. Error bars indicate SD. (C and C′) UV exposure has no effect on Ctr MO-injected embryos. (D) sema3d morphants show typical phenotype of widened CCV with lesions in the leading edge (black arrowhead). (E and E′) Without UV induction, the AS+SE-photo-MO–injected embryos resemble Ctr MO. (F and F′) UV activation of AS+SE-photo-MO–injected embryos at 9 hpf results in the sema3d MO phenotype (compare with D and D′). (G and G′) After UV exposure at 24 hpf, AS+SE-photo-MO–injected embryos exhibit an intermediate CCV width (compare with F) but disrupted cell–cell contacts (black arrowhead). (H and H′) AS+SE-photo-MO–injected embryos, exposed to UV light at 27 hpf, exhibit a CCV of normal width (compare with F) but disrupted cell–cell contacts in the front (black arrowhead). |
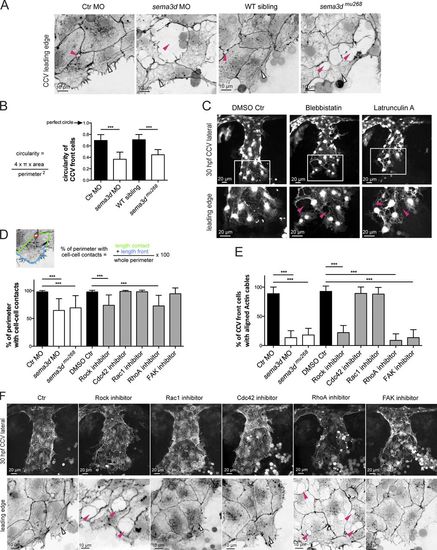
Sema3d acts on Actin network organization in leading edge ECs controlling Actin cable formation, cell shape, and contacts. (A) The cohesive cell sheet in the CCV leading edge is disrupted and exhibits lesions (pink arrowheads) in sema3d morphants and mutants at 30 hpf. In Ctr embryos, Actin cables are arranged parallel to the leading front; they are absent in Sema3d-deficient embryos (open arrowheads). High-resolution confocal projections of Tg(fli1a:lifeactEGFP)mu240 embryos from Fig. 1 F were color-inverted. (B) Quantification of the circularity of CCV leading edge cells illustrates that loss of sema3d significantly alters cell shape (each n = 24). (C) Inhibition of Myosin/Actin phenocopies sema3d phenotype of disrupted cell–cell contacts (pink arrowheads) but does not lead to a wider CCV. Confocal projections of Tg(kdrl:EGFP)s843 embryos at 30 hpf. (D) The length of cell perimeter with cell–cell contacts of CCV leading edge cells is reduced in sema3d morphants and mutants and after Rock or RhoA inhibition. Inhibition of Rac1, Cdc42, or FAK had no effect on cell–cell contacts (n = 30 for morphants and mutant cells and n = 18 for inhibitor experiments). (E) Quantification of front cells with aligned Actin cables (n = 10 for morphants or mutants and n = 7 for inhibitor experiments). (F) Lateral confocal projections of Tg(fli1a:lifeactEGFP)mu240 embryos at 30 hpf. Leading edge high magnifications were color-inverted. Inhibition of Rock and RhoA induced lesions in the leading edge (pink arrowheads). Parallel-arranged Actin cables (open arrowheads) are missing after inhibition of Rock, RhoA, or FAK. ***, P < 0.001. Error bars indicate SD. |
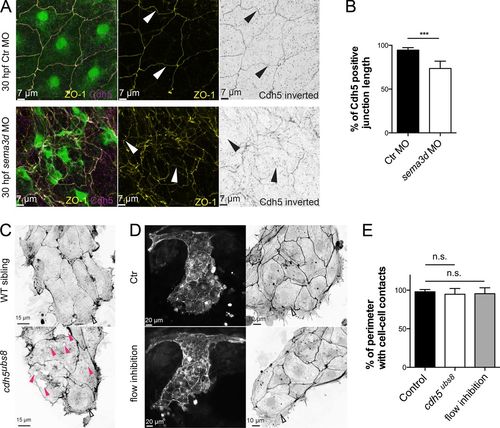
Loss of cell–cell contacts in the CCV leading edge did not depend on flow or Cdh5. (A) Antibody staining for ZO-1 and Cdh5 showed aberrant junction distribution and impaired cell shape upon sema3d loss. Arrowheads indicate gaps in Cdh5 protein distribution. (B) The length of Cdh5-positive cell–cell connections is reduced in sema3d morphants (n = 4). (C) Cell–cell connections in the CCV leading edge of cdh5ubs8 mutant embryos are present, but the ECs exhibit holes inside the cells (pink arrowheads). (D) Flow inhibition with nifedipine and tricaine did not lead to lesions or impaired Actin cable alignment in the CCV leading edge. Parallel-arranged Actin cables are indicated by open arrowheads. (E) Quantification of cell–cell-contact length of CCV leading edge cells (n = 16). ***, P < 0.001; n.s., not significant. Error bars indicate SD. |
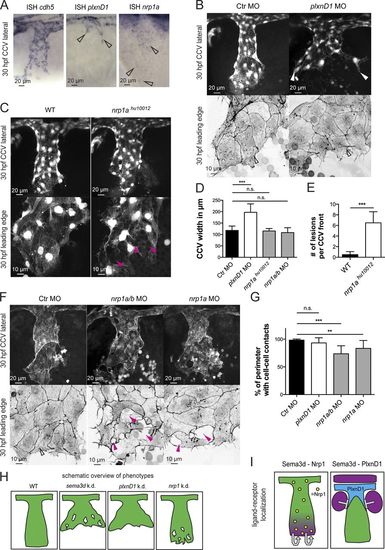
Differential Sema3d functions are transduced by signaling through the different receptors Nrp1 or PlxnD1. (A) In situ hybridization (ISH) of 30-hpf embryos showing cdh5 expression in all CCV cells, plxnD1 expression in the dorsal-most CCV cells (open arrowheads), and nrp1 expression in all CCV cells (open arrowheads). (B–G) Analysis of PlxnD1 or Nrp1 deficiency in Tg(kdrl:EGFP)s843 or Tg(fli1a:lifeactEGFP)mu240 embryos at 30 hpf. (B) Loss of PlxnD1 led to a wider CCV (white arrowheads), but cell–cell contacts were not impaired, and parallel-arranged Actin cables were present (open arrowheads). (C) nrp1ahu10012 mutant embryos had reduced cell–cell contacts (pink arrowheads) but did not exhibit a wider CCV. (D) Quantification of CCV front width (each n = 11; nrp1ahu10012, n = 4). (E) Number of lesions in nrp1ahu10012 mutant embryos is increased compared with WT (n = 4). (F) nrp1a/b and nrp1a morphant CCVs exhibit a normal width, but the leading edges showed lesions (pink arrowheads) and lacked Actin cables (compare with open arrowhead in Ctr). (G) Quantification of cell–cell contact length (each n = 13). (H) Schematic overview of phenotypes comparing Sema3d deficiency with plxnD1 and nrp1 knockdown. (I) Schematic illustration of ligand-receptor localization indicating autocrine Sema3d-Nrp1 signaling and paracrine Sema3d-PlxnD1 signaling. Magenta, sema3d expression; green, CCV ECs; blue, plxnD1 expression; and yellow, nrp1 expression. ***, P < 0.001; **, P < 0.01; n.s., not significant. Error bars indicate SD. |
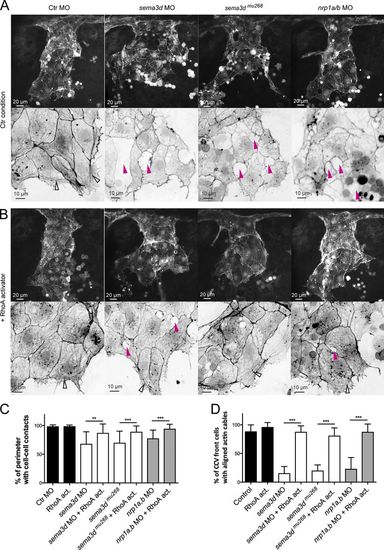
Sema3d-Nrp1 signaling regulates cell–cell contacts and Actin cable formation in the CCV leading edge by activating RhoA. (A and B) Lateral confocal projections of Tg(fli1a:lifeactEGFP)mu240 embryos at 30 hpf. Magnifications of the leading edges were color-inverted. (A) sema3d morphants and mutants as well as nrp1a/b morphants exhibited lesions in the leading edge (pink arrowheads) and lacked parallel-arranged Actin cables (open arrowhead in Ctr MO). (B) Activation of RhoA from 24 to 30 hpf reduced lesions (pink arrowheads) and rescued Actin cable formation (open arrowheads) in sema3d morphants and mutants as well as in nrp1a/b morphants. (C and D) Quantification of cell–cell contact length (C, n = 16) and cells with Actin cables (D, each n = 8; sema3dmu268 + RhoA activator, n = 4). ***, P < 0.001; **, P < 0.01. Error bars indicate SD. |
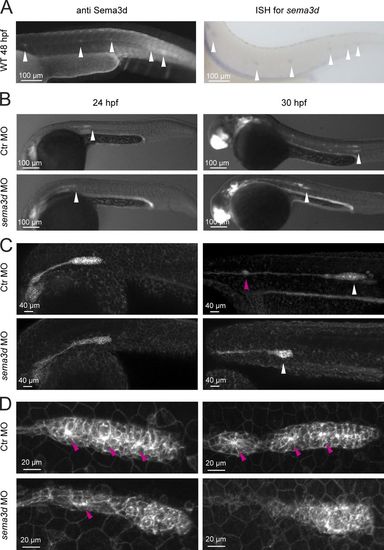
Collective migration and cell morphology of the LLP are impaired in sema3d morphants. (A) Sema3d antibody staining and in situ hybridization (ISH) for sema3d showed Sema3d expression in the LLP and its deposited neuromasts (white arrowheads). (B) LLP migration distance is reduced in sema3d morphants at 24 and 30 hpf in Tg(-8.0cldnb:lynEGFP)zf106 embryos (LLP indicated by white arrowheads). (C) Deposition of neuromasts (pink arrowhead) is impaired in sema3d morphants at 30 hpf. (D) Organized LLP rosette structure (pink arrowheads) and cell morphology are impaired in sema3d morphants at 24 and 30 hpf. |