
Fig. 7
- ID
- ZDB-IMAGE-170224-12
- Genes
- Publication
- Hamm et al., 2016 - Sema3d controls collective endothelial cell migration by distinct mechanisms via Nrp1 and PlxnD1
- All Figures
- Figures for Hamm et al., 2016
|
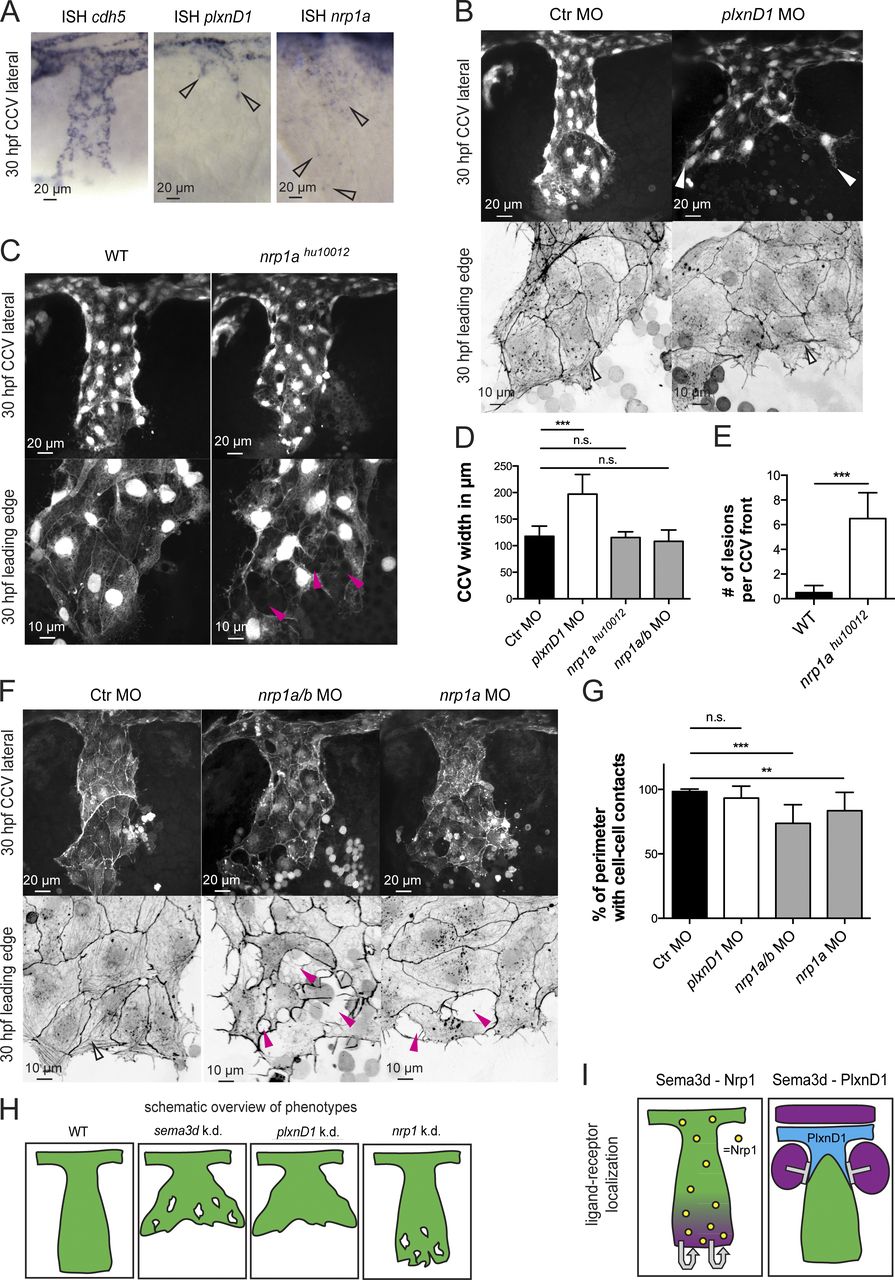
Fig. 7 Differential Sema3d functions are transduced by signaling through the different receptors Nrp1 or PlxnD1. (A) In situ hybridization (ISH) of 30-hpf embryos showing cdh5 expression in all CCV cells, plxnD1 expression in the dorsal-most CCV cells (open arrowheads), and nrp1 expression in all CCV cells (open arrowheads). (B–G) Analysis of PlxnD1 or Nrp1 deficiency in Tg(kdrl:EGFP)s843 or Tg(fli1a:lifeactEGFP)mu240 embryos at 30 hpf. (B) Loss of PlxnD1 led to a wider CCV (white arrowheads), but cell–cell contacts were not impaired, and parallel-arranged Actin cables were present (open arrowheads). (C) nrp1ahu10012 mutant embryos had reduced cell–cell contacts (pink arrowheads) but did not exhibit a wider CCV. (D) Quantification of CCV front width (each n = 11; nrp1ahu10012, n = 4). (E) Number of lesions in nrp1ahu10012 mutant embryos is increased compared with WT (n = 4). (F) nrp1a/b and nrp1a morphant CCVs exhibit a normal width, but the leading edges showed lesions (pink arrowheads) and lacked Actin cables (compare with open arrowhead in Ctr). (G) Quantification of cell–cell contact length (each n = 13). (H) Schematic overview of phenotypes comparing Sema3d deficiency with plxnD1 and nrp1 knockdown. (I) Schematic illustration of ligand-receptor localization indicating autocrine Sema3d-Nrp1 signaling and paracrine Sema3d-PlxnD1 signaling. Magenta, sema3d expression; green, CCV ECs; blue, plxnD1 expression; and yellow, nrp1 expression. ***, P < 0.001; **, P < 0.01; n.s., not significant. Error bars indicate SD.