
- Title
-
Reck enables cerebrovascular development by promoting canonical Wnt signaling
- Authors
- Ulrich, F., Carretero-Ortega, J., Menéndez, J., Narvaez, C., Sun, B., Lancaster, E., Pershad, V., Trzaska, S., Véliz, E., Kamei, M., Prendergast, A., Kidd, K.R., Shaw, K.M., Castranova, D.A., Pham, V.N., Lo, B.D., Martin, B.L., Raible, D.W., Weinstein, B.M., Torres-Vazquez, J.
- Source
- Full text @ Development
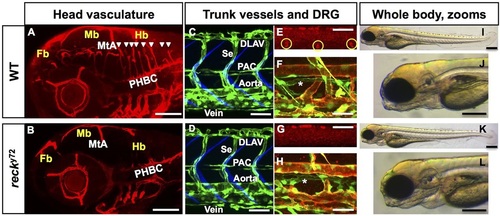
nft y72 mutant embryos lack intracerebral blood vessels and DRG but have normal body morphology. Confocal (A-H) and bright-field (I-L) lateral images. Anterior, left; dorsal, up. A,B,E,G: 72 hpf; C,D: 48 hpf; F,H: 96 hpf; I-L: 60 hpf. (A,B) Central Arteries (CtAs) are found in WT (A) (white arrowheads) but are missing in nft y72 mutants (B); the other head vessels are present in nft y72. Blood vessels [Tg(kdrl:RFP)s896], red. WT (C) and nft y72 mutants (D) show identical trunk vascular patterns. Endothelium [Tg(fli1a:eGFP)y1], green; somite boundaries, blue (Zygmunt et al., 2011). DRG (yellow circles; red HuC immunofluorescence) are present in WT (E) but absent in nft y72 mutants (G). (F,H) Blood vessels are green [Tg(fli1a:eGFP)y1] and red [Tg(kdrl:RFP)s896]; lymphatics (asterisks) are green only [Tg(fli1a:eGFP)y1]. (J,L) Close-ups of head in I,K. MtA, metencephalic artery; PHBC, primordial hindbrain channel; DLAV, dorsal longitudinal anastomotic vessel; Se, intersegmental vessel; PAC, parachordal chain; Fb, forebrain; Mb, midbrain; Hb, hindbrain. Scale bars: 100µm in A,B, 50µm in C-E,G, 25µm in F,H and 200µm in I-L. See also Fig. S1, Movies 1-14 and Table S1. |
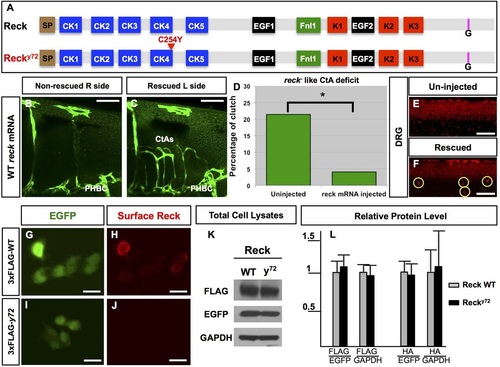
nft y72 is a genetically null allele of reck. (A) WT zebrafish Reck (top) is 955 aa long and features the same domains and motifs found in mammalian RECK (Takahashi et al., 1998). N-terminal signal peptide (SP; brown), cysteine knot motifs (CK1-5; blue), epidermal growth factor-like repeats (EGF1-2; black), fibronectin-like type I module (Fnl1; green), Kazal motifs (K1-3; red), C-terminal GPI transferase cleaveage site (G; pink). Mutant Recky72 (bottom) harbors a missense amino acid change in an evolutionarily conserved Cys residue within CK4. (B-F) Providing WT reck mRNA to reck y72 mutants restores formation of both CtAs (B-D) and DRG (E,F). Embryos with unilateral CtA rescue {B,C; endothelium, green [Tg(fli1a:eGFP)y1]} or bilateral DRG rescue (F; yellow circles, red HuC immunofluorescence; only one side shown). Quantification of CtA rescue expressed as the percentage of embryos (from incrossing heterozygous mutant carriers) with reck-like CtA deficits (D). (G-L) Exogenous co-expression of epitope-tagged zebrafish Reck (WT Reck or mutant Recky72) with cytosolic EGFP in cultured mammalian cells. (G-J) Immunofluorescence-based detection of surface 3×FLAG-Reck (red) and EGFP fluorescence (green) in non-permeabilized 293T cells. 3×FLAG-Recky72 fails to reach the cell surface (J). (K,L) WT and mutant Recky72 expressed in COS7 cells show similar abundance. (K) Western blot of total cell lysates from cells expressing WT or mutant 3xFLAG-Reck. (L) Densitometry-based quantification total cell lysates from cells expressing WT Reck or mutant Recky72 zebrafish proteins tagged with 3×FLAG or 2×HA. Protein levels normalized with EGFP and GAPDH. Error bars: s.e.m. Scale bars: 50µm in B-C, 100µm in E,F and 10µm in G-J. See also Figs S2, S3, Movies 1-14 and Table S1. |
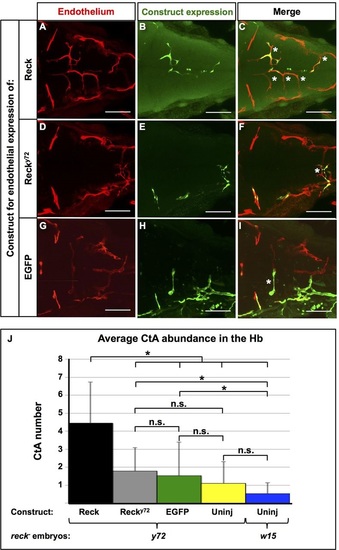
Mosaic endothelial expression of WT Reck is sufficient to rescue the CtA deficit of reck y72 mutant embryos. (A-I) Dorsal views (dorsal level to show CtAs) of the 72hpf Hb vasculature {red [Tg(kdrl:RFP)s896]} of reck y72 injected with constructs driving endothelial expression of exogenous Reck, Recky72 (both HA-tagged, see Fig. 2L) or EGFP proteins (green). Anterior, left; right side, up. (C,F,I) White asterisks indicate CtAs with exogenous expression of listed proteins. Scale bars, 100µm. (J) Quantification of CtA abundance in the Hb of reck y72 and Df(Chr24:reck)w15 with or without (‘Uninj’) exogenous endothelial expression of listed proteins. Asterisks indicate significant differences (P<0.001); n.s., not significant; Student′s t-test. reck y72 mutants scored: Reck (n=28), Recky72 (n=14), EGFP (n=19), Uninj (n=20). Df(Chr24:reck)w15 mutants scored: Uninj (n=19). See also Fig. 4, Figs S6, S11. |
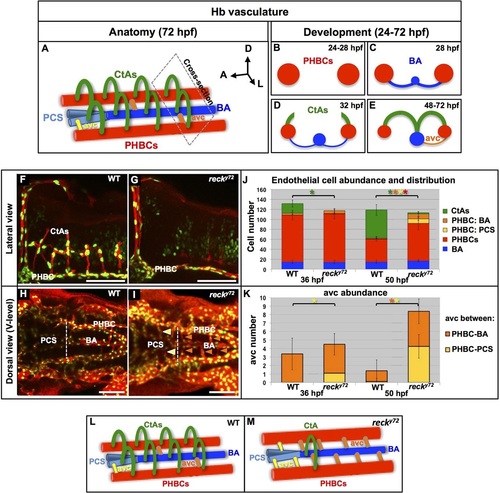
CtA deficit in reck y72 mutant embryos is due to impaired endothelial cell migration from the perineural PHBCs. (A-E) WT Hb vasculature anatomy (A; anterior half detail) and development (B-E; cross-sections ‘cut’ along plane in A. Dorsal, up. PHBCs, red; BA, dark blue; PCS, light blue; avcs (PCS-connected, yellow; BA-connected, orange), CtAs; green. (F-K) Abundance and distribution of Hb endothelial cells and avcs at 36 and 50hpf in WT and reck y72 embryos. (F-I) Confocal images (50hpf). Endothelium, red [Tg(kdrl:RFP)s896]; endothelial nuclei, green [Tg(kdrl:eGFP-NLS)zf109]. Anterior, left. Scale bars: 100µm. (F,G) Lateral views; dorsal, up. (H,I) Dorsal views (ventral level) of extracerebral vessels; left side, bottom. Arrowheads, avcs (PCS-connected, yellow; BA-connected, orange). (J,K) Quantification and distribution of endothelial cells (J) and abundance of avcs (K). Asterisks and bars are color matched. Asterisks indicate significant differences (P<0.001) between age-matched genotypes (Student′s t-test). n=10 embryos per genotype and stage. Error bars indicate s.d. (L,M) Diagrams of the Hb vasculature phenotypes (anterior half detail) in WT (L) and reck y72 embryos (M). The mutant shows a dramatic CtA deficit, hyperplastic PHBCs and too many avcs. See also Figs S4, S5, Movies 15, 16 and Table S2. |
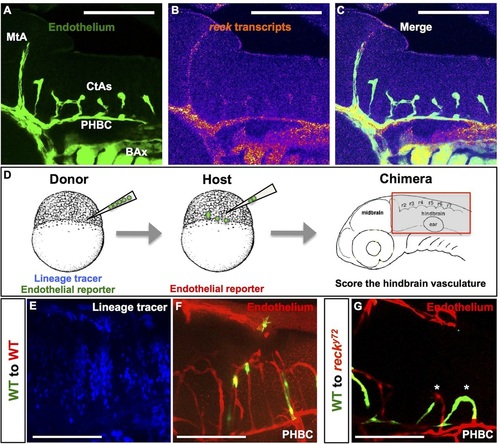
reck is expressed in the cerebral endothelium where it is required non-cell autonomously for intracerebral vascularization. (A-C) Confocal lateral views of a 48hpf WT Hb. Anterior, left; dorsal, up. (A) Endothelium is green [Tg(fli1a:eGFP)y1]. (B) Fluorescent intensity of reck transcripts detected via RNA in situ HCR. Warmer and cooler colors represent, respectively, signals of higher and lower fluorescent intensity. reck is expressed in cerebral vessels (MtA, CtAs and PHBC) and BAx. (D) Workflow of cell transplantation experiments. Chimeras were analyzed at ~72hpf. (E-G) Confocal lateral views of the Hb of two chimeras. Anterior, left; dorsal, up. Donor endothelium, green [Tg(kdrl:EGFP)1a116]; host endothelium, red [Tg(kdrl:RFP)s896]; lineage tracer, blue (Rhodamine 647 Dextran). (E,F) Chimera made using WT embryos. Note mosaicism in both the Hb environment (blue) and the CtAs (green and red). (G) Chimera made using a WT donor and a reck y72 host. Note mosaic CtAs (asterisks) containing both WT (green) and mutant (red) endothelial cells. Scale bars: 100µm. EXPRESSION / LABELING:
|
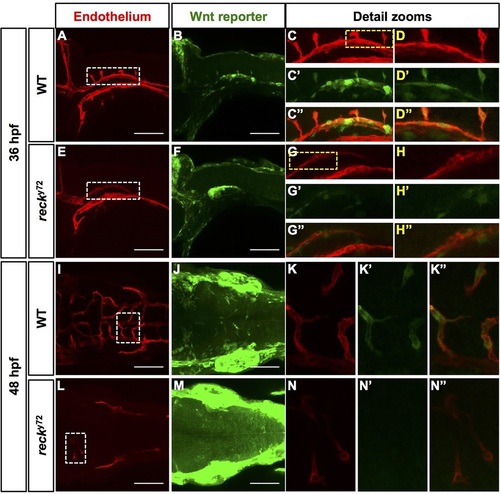
The cerebrovascular expression of the transgenic reporter of canonical Wnt signaling Tg(7xTCF-Xla.Siam:GFP)ia4 is specifically lost in reck y72 mutant embryos. (A-N′′) Confocal images (anterior, left) of 36 and 48hpf Hbs from WT and reck y72. Views: lateral (A-H′′; dorsal, up); dorsal (I-N′′; right side, up). Endothelium, red [Tg(kdrl:RFP)s896]; Wnt reporter, green [Tg(7xTCF-Xla.Siam:GFP)ia4]. In the WT, Wnt reporter expression highlights the PHBCs (A-D′′), CtAs (A-D′′,I-K′′) and additional non-vascular tissues. However, in reck y72 mutants, expression of the Wnt reporter is undetectable in PHBCs (E-H′′,L-N′′) and occasional CtAs (N-N′′), but is present elsewhere. Detail zooms: Regions in white dashed boxes (A,E,I,L) shown in C-C′′,G-G′′,K-K′′ and N-N′′, respectively; regions in yellow dashed boxes (C,G) shown in D-D′′ and H-H′′, respectively. See also Fig. 8. |
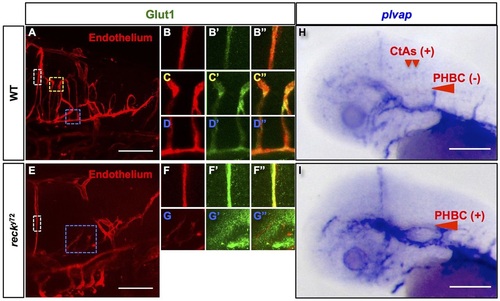
reck y72 mutant embryos show aberrant cerebrovascular expression of the Wnt-responsive markers of barriergenic differentiation Glut1 and plvap. (A-G′′) Confocal lateral images of the 72hpf Hb vasculatures of WT (A-D′′) and reck y72 embryos (E-G′′). Anterior, left; dorsal, up. Endothelium, red [Tg(kdrl:RFP)s896 ]; Glut1 immunofluorescence, green. Colored dashed boxes (A,E) demarcate a region of the following vessels: white, MtA (zooms: B-B′′,F-F′′); yellow, CtAs (zooms: C-C′′); blue, PHBCs (zooms: D-D′′,G-G′′). Merged images of zooms are shown in B′′,C′′,D′′,F′′,G′′. Glut1 decorates the MtA, CtAs and PHBCs of the WT (n=7 embryos). By contrast, Glut1 decorates the MtA, but not the PHBCs, of reck y72 (n=10 embryos). (H,I) Transmitted light images of the 48hpf heads of embryos subjected to whole-mount RNA in situ hybridization with plvap riboprobes. (H) In the WT, plvap is expressed in the dorsal aspect of CtAs but not in the PHBCs (n=57 embryos). (I) In reck y72 mutants, plvap is ectopically expressed in the PHBCs (n=8 embryos). Scale bars: 100µm. Merged images of detail zooms are shown in C′′,D′′,G′′,H′′,K′′,N′′. Scale bars: 100µm. See also Figs S7-S9. EXPRESSION / LABELING:
PHENOTYPE:
|
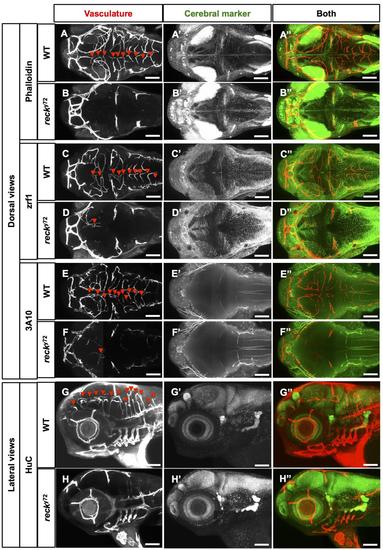
Normal gross cerebral organization in recky72. (A-H′′) Confocal views; 72 hpf embryo heads. Anterior, left. (A-F′′′) Dorsal views; left side, bottom. (G-H′′) Lateral views; dorsal, up. Scale Bar: 100 µm. Genotypes, vasculature and cerebral markers as indicated. Vasculature: Tg(kdrl:RFP)s896 or Tg(kdrl:eGFP)1a116. Cerebral markers: phalloidin staining (labels F-actin at the interface of actin subunits), zrf1 (radial glia), 3A10 (labels a subset of hindbrain spinal cord projecting neurons, including Mauthner neurons) and HuC (pan-neuronal marker) immunofluorescence; see (Brand et al., 1996; Kim et al., 1996; Lowery et al., 2009)(Ulrich et al., 2011). |
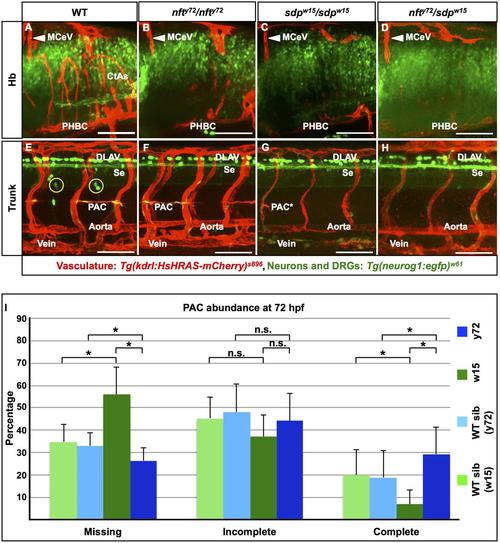
nfty72/sdpw15 trans-heterozygotes and both nfty72 and sdpw15 homozygotes have identical CtA and DRG deficits. (A-H) Confocal lateral images of the Hb (A-D) and trunk (E-H) of 72 hpf embryos. Anterior, left; dorsal, up. Vasculature (white labels), red (Tg(kdrl:RFP)s896); DRG neurons, green (in yellow circles, Tg(neurog1:eGFP)w61). Scale bars: 100 µm. (I) Quantification of the abundance of missing, incomplete and complete Parachordal Chains (PAC) at 72 hpf in nfty72 (recky72) and sdpw15 (Df(Chr24:reck)w15) mutants and their phenotypically-WT siblings. A complete PAC spans the full distance between an ipsilateral Se vessel pair. PAC percentages were thus calculated in reference to the total number of Se vessel pairs scored. Asterisks, significant differences (p < 0.05) between genotypes (Student′s t-test); n.s., no significant. n=10 embryos per genotype or phenotype. |
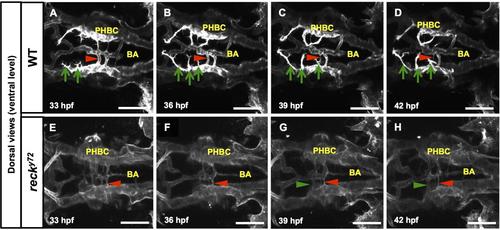
In recky72 the PHBCs are deficient in CtA sprout formation and display abnormal avc dynamics. Time-lapse stills (dorsal views, ventral-level) of Hb vascular development (visualized with Tg(kdrl:GFP)1a116) in WT (A-D) and recky72 (E-H) from 33 to 42 hpf. Anterior, left; right side, up. Green arrows, developing CtA sprouts on the embryo’s left side. Green arrows, de novo avc formation. Red arrowheads, regressing avc. In this WT (A-D) three filopodia-rich CtA sprouts launch from the dorsal side of the left PHBC, one PHBC-BA avc thins and regresses but no new avc develop. In this recky72 (E-H) filopodial activity is absent from the dorsal face of the PHBCs and, accordingly, no CtA-like, dorsally projecting sprouts emerge. On the mutant’s left side a PHBC-BA avc regresses and another forms. There is no evidence that the mutant’s supernumerary avc are mistargeted CtAs unable to invade the brain. Scale bars: 100 µm. See Movies S2A-S2B. |
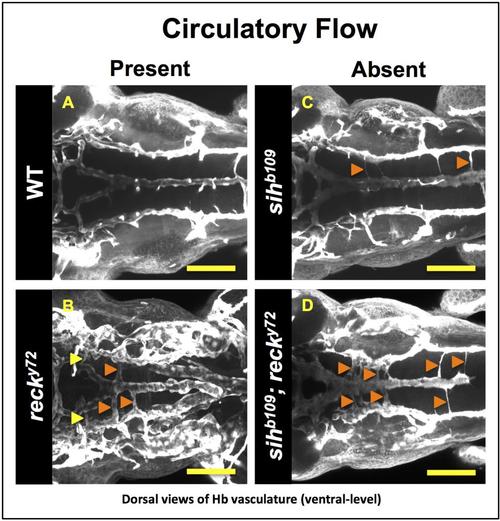
reck limits avc abundance even in the absence of circulatory flow. (A-D) Confocal images (dorsal view) of the 48 hpf peri-neural vasculature. Genotypes as indicated. Arrowheads, avc (PCS-connected, yellow; BA-connected, orange). Scale bars: 100 µm. See Table S2. |
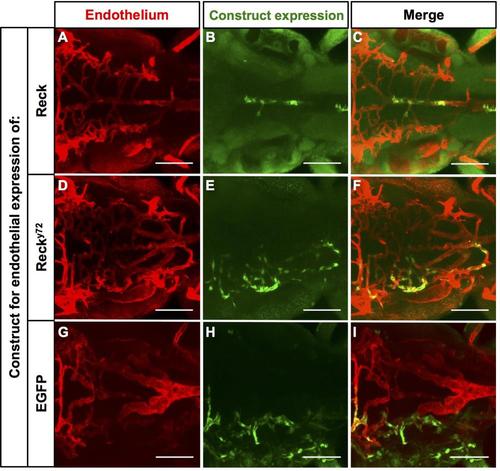
Examples of the distribution of clones with exogenous endothelial expression of Reck, Recky72 or EGFP in the 72 hpf Hb vasculature of recky72 mutants. (A-I) Dorsal views (ventral-level) of the Hb extra-cerebral vasculature (red, Tg(kdrl:RFP)s896) of recky72 injected with constructs driving endothelial expression of exogenous Reck, Recky72 (both HA-tagged, see Fig. 2L) or EGFP proteins (green). Anterior, left. Right side, up. Scale Bars: 100 µm. See also Figure 5 and Graph S1. |
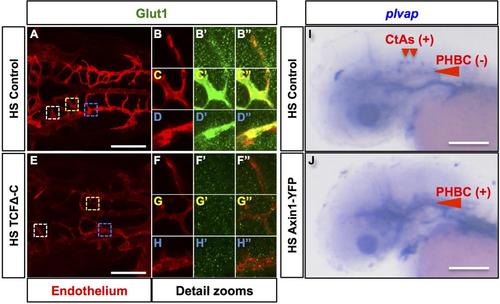
Forced inhibition of canonical Wnt signaling impairs CtA formation and leads to aberrant cerebrovascular expression of the Wnt-responsive markers of barriergenic differentiation Glut1 and plvap. (A-H′′) Confocal dorsal images of the 48 hpf Hb vasculatures of heat-shocked (HS) embryos without (Control) or with TCFΔC (Tg(hsp70l:Xla.TCFΔC-EGFP) over-expression. Heat-shock: 40°C for 30 minutes at 30 hpf. Anterior, left. Right side, up. Endothelium, red (Tg(kdrl:RFP)s896); Glut1 immunofluorescence, green. Colored dashed boxes (A, E) demarcate a region of the following vessels: white, MtA (zooms: B-B′′, F-F′′); yellow, CtAs (zooms: C-C′′, G-G′′); blue, PHBCs (zooms: DD′′, H-H′′). Merged images of zooms: B′′, C′′, D′′, F′′, G′′, H′′. Glut1 decorates the MtA, CtAs and PHBCs of the Control (n=2 embryos). In contrast, in the TCFΔC over-expressing embryo CtA abundance is reduced (n=10 embryos) and cerebrovascular Glut1 decoration is missing (n=2 embryos). (I-J) Transmitted-light lateral images of the 48 hpf heads of heat-shocked (HS) embryos without (Control) or with Axin1-YFP (Tg(hsp70l:Mmu.Axin1-YFP)w35) over-expression subjected to whole mount RNA in situ hybridization with plvap riboprobes. Heat-shock: 39oC for 1 hour at 24 hpf. (I) Control. plvap is expressed in the dorsal aspect of CtAs but not in the PHBCs (n=9 embryos). (J) Axin1-YFP overexpressing embryo. plvap is ectopically expressed in the PHBCs (n=7 embryos). Anterior left. Dorsal up. Scale bar: 100 µm. |
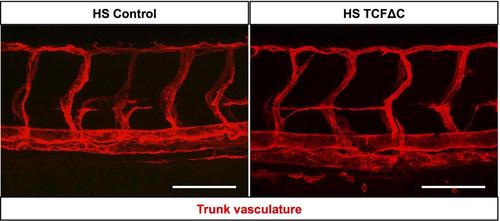
Forced inhibition of canonical Wnt signaling at 30 hpf has no impact on the patterning of the trunk vasculature. Confocal lateral images of the 48 hpf trunk vasculatures (red; Tg(kdrl:RFP)s896) of heat-shocked (HS) embryos without (Control) or with TCFΔC (Tg(hsp70l:Xla.TCFΔC-EGFP) over-expression. Heat-shock: 40°C for 30 minutes at 30 hpf. Anterior, left; dorsal, up. Scale bars: 100 µm. |
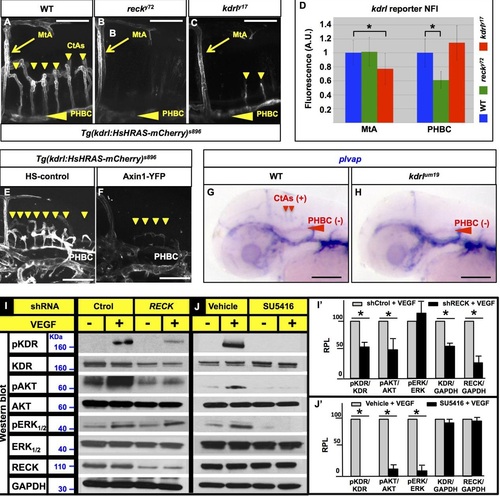
reck and canonical Wnt signaling promote the cerebrovascular expression of the transgenic kdrl transcriptional reporter Tg(kdrl:RFP)s896 in zebrafish and RECK promotes VEGF signaling in HUVEC. (A-C, E-F) Confocal lateral images of the live fluorescence of Tg(kdrl:RFP)s896 (white) in the Hb vasculatures of WT (A), recky72 (B), kdrly17 (C) and heat-shocked (HS) embryos without (E) or with (F) inhibition of canonical Wnt signaling via Axin1-YFP (Tg(hsp70l:Mmu.Axin1-YFP)w35) over-expression. Anterior, left; dorsal, up. (A-C) 58 hpf. (E-F) 48 hpf. (D) Quantification of the Normalized Fluorescence Intensity (NFI) of Tg(kdrl:RFP)s896 in the MtAs and PHBCs of WT, recky72 and kdrly17 at 58 hpf expressed in fluorescence Arbitrary Units (A. U.). Asterisks, significant differences (p<0.05). Student’s t-test. n=10 embryos per genotype. Vertical lines, SD. (A-D) The PHBC fluorescence of Tg(kdrl:RFP)s896 is reduced in recky72 but not in kdrly17, while that of the MtA is only reduced in kdrly17. (E-F) Both CtA abundance and Tg(kdrl:RFP)s896 cerebrovascular fluorescence are reduced in Axin1-YFP over-expressing 48 hpf embryos. Heat-shock: 39°C for 1 hour at 24 hpf. (G-H) Transmitted-light lateral images of the 48 hpf heads of phenotypically WT-siblings (G) and kdrlum19 (H) subjected to whole mount RNA in situ hybridization with plvap riboprobes. In the WT siblings plvap is expressed (+) in the dorsal aspect of CtAs but not (-) in the PHBCs (n=11 embryos). In kdrlum19 mutants plvap is also not expressed (-) in the PHBCs (n=11 embryos) and the CtAs are missing. (A-C, E-H) Small down-pointing arrowheads (yellow or red), CtAs; large left-pointing arrowheads (yellow or red), PHBCs. Scale bars: 100 µm. (I, J) Western Blots of biochemical readouts of VEGF-A signaling. Conditions, above. Detected proteins and molecular weight markers, left. (I′, J′) Bar graphs of Western Blot quantifications. y axis, Relative Protein Level (RPL) measured by densitometry. x axis, protein and/or phospho-isoform. n=3. Asterisks, significant differences (p<0.05); Student’s t-test (vertical lines, SEM). |
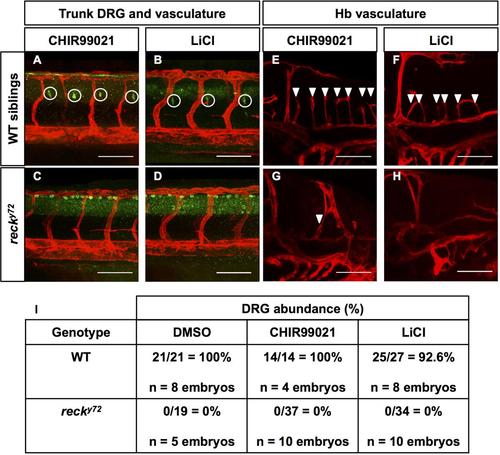
Chemical activation of canonical Wnt signaling with the GSK3b inhibitors CHIR99021 and LiCl fails to rescue the DRG and CtA deficits of recky72 mutants. (A-H) Confocal lateral images at 72 hpf. Anterior, left; dorsal, up. Scale Bars: 100 µm. Genotypes and treatments as indicated. (A-D) DRG (white circles, green HuC immunofluorescence) and vasculature (Tg(kdrl:HsHRAS-mCherry)s896; red) in the trunk. (E-H) Hb vasculature (Tg(kdrl:HsHRAS-mCherry)s896; red). Central Arteries (CtA; white arrowheads). (I) Quantification of DRG abundance in WT and recky722 mutants treated with DMSO vehicle, CHIR99021 and LiCl. DRG abundance was scored by imaging a region of the anterior trunk at the level of the yolk extension spanning 3-4 Se vessels (in WT animals there is one DRG per Se vessel). Thus, the percentages were calculated from the ratio of DRG found/DRG expected. |