
|
Fig. S9
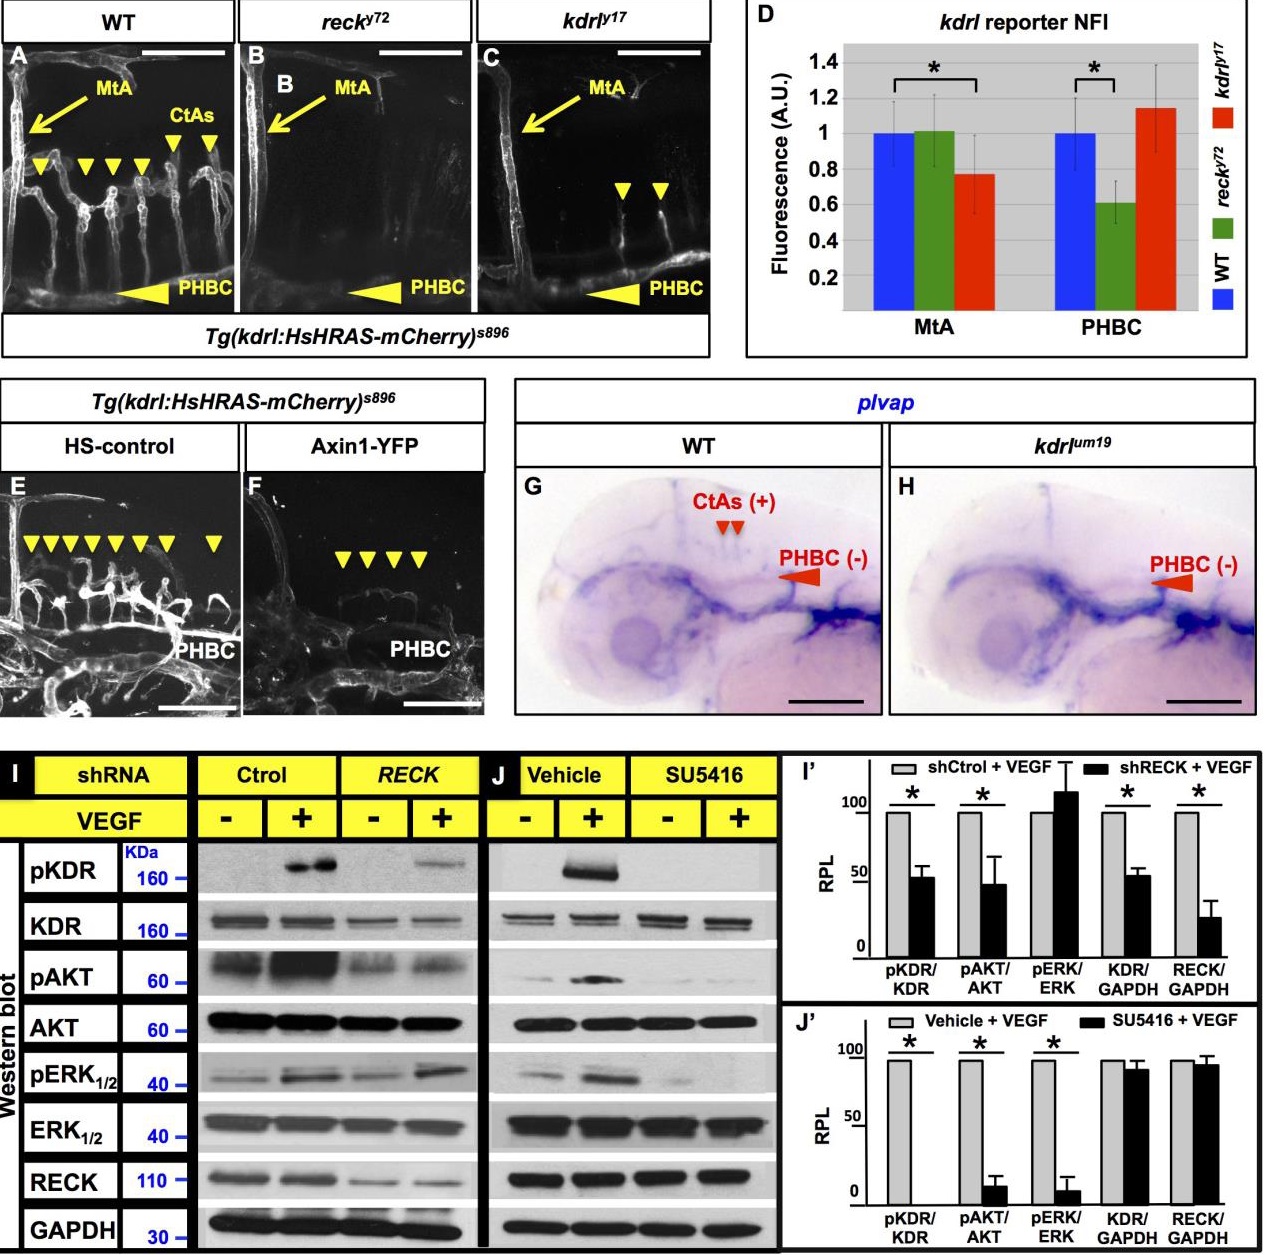
reck and canonical Wnt signaling promote the cerebrovascular expression of the transgenic kdrl transcriptional reporter Tg(kdrl:RFP)s896 in zebrafish and RECK promotes VEGF signaling in HUVEC. (A-C, E-F) Confocal lateral images of the live fluorescence of Tg(kdrl:RFP)s896 (white) in the Hb vasculatures of WT (A), recky72 (B), kdrly17 (C) and heat-shocked (HS) embryos without (E) or with (F) inhibition of canonical Wnt signaling via Axin1-YFP (Tg(hsp70l:Mmu.Axin1-YFP)w35) over-expression. Anterior, left; dorsal, up. (A-C) 58 hpf. (E-F) 48 hpf. (D) Quantification of the Normalized Fluorescence Intensity (NFI) of Tg(kdrl:RFP)s896 in the MtAs and PHBCs of WT, recky72 and kdrly17 at 58 hpf expressed in fluorescence Arbitrary Units (A. U.). Asterisks, significant differences (p<0.05). Student’s t-test. n=10 embryos per genotype. Vertical lines, SD. (A-D) The PHBC fluorescence of Tg(kdrl:RFP)s896 is reduced in recky72 but not in kdrly17, while that of the MtA is only reduced in kdrly17. (E-F) Both CtA abundance and Tg(kdrl:RFP)s896 cerebrovascular fluorescence are reduced in Axin1-YFP over-expressing 48 hpf embryos. Heat-shock: 39°C for 1 hour at 24 hpf. (G-H) Transmitted-light lateral images of the 48 hpf heads of phenotypically WT-siblings (G) and kdrlum19 (H) subjected to whole mount RNA in situ hybridization with plvap riboprobes. In the WT siblings plvap is expressed (+) in the dorsal aspect of CtAs but not (-) in the PHBCs (n=11 embryos). In kdrlum19 mutants plvap is also not expressed (-) in the PHBCs (n=11 embryos) and the CtAs are missing. (A-C, E-H) Small down-pointing arrowheads (yellow or red), CtAs; large left-pointing arrowheads (yellow or red), PHBCs. Scale bars: 100 µm. (I, J) Western Blots of biochemical readouts of VEGF-A signaling. Conditions, above. Detected proteins and molecular weight markers, left. (I′, J′) Bar graphs of Western Blot quantifications. y axis, Relative Protein Level (RPL) measured by densitometry. x axis, protein and/or phospho-isoform. n=3. Asterisks, significant differences (p<0.05); Student’s t-test (vertical lines, SEM).