
|
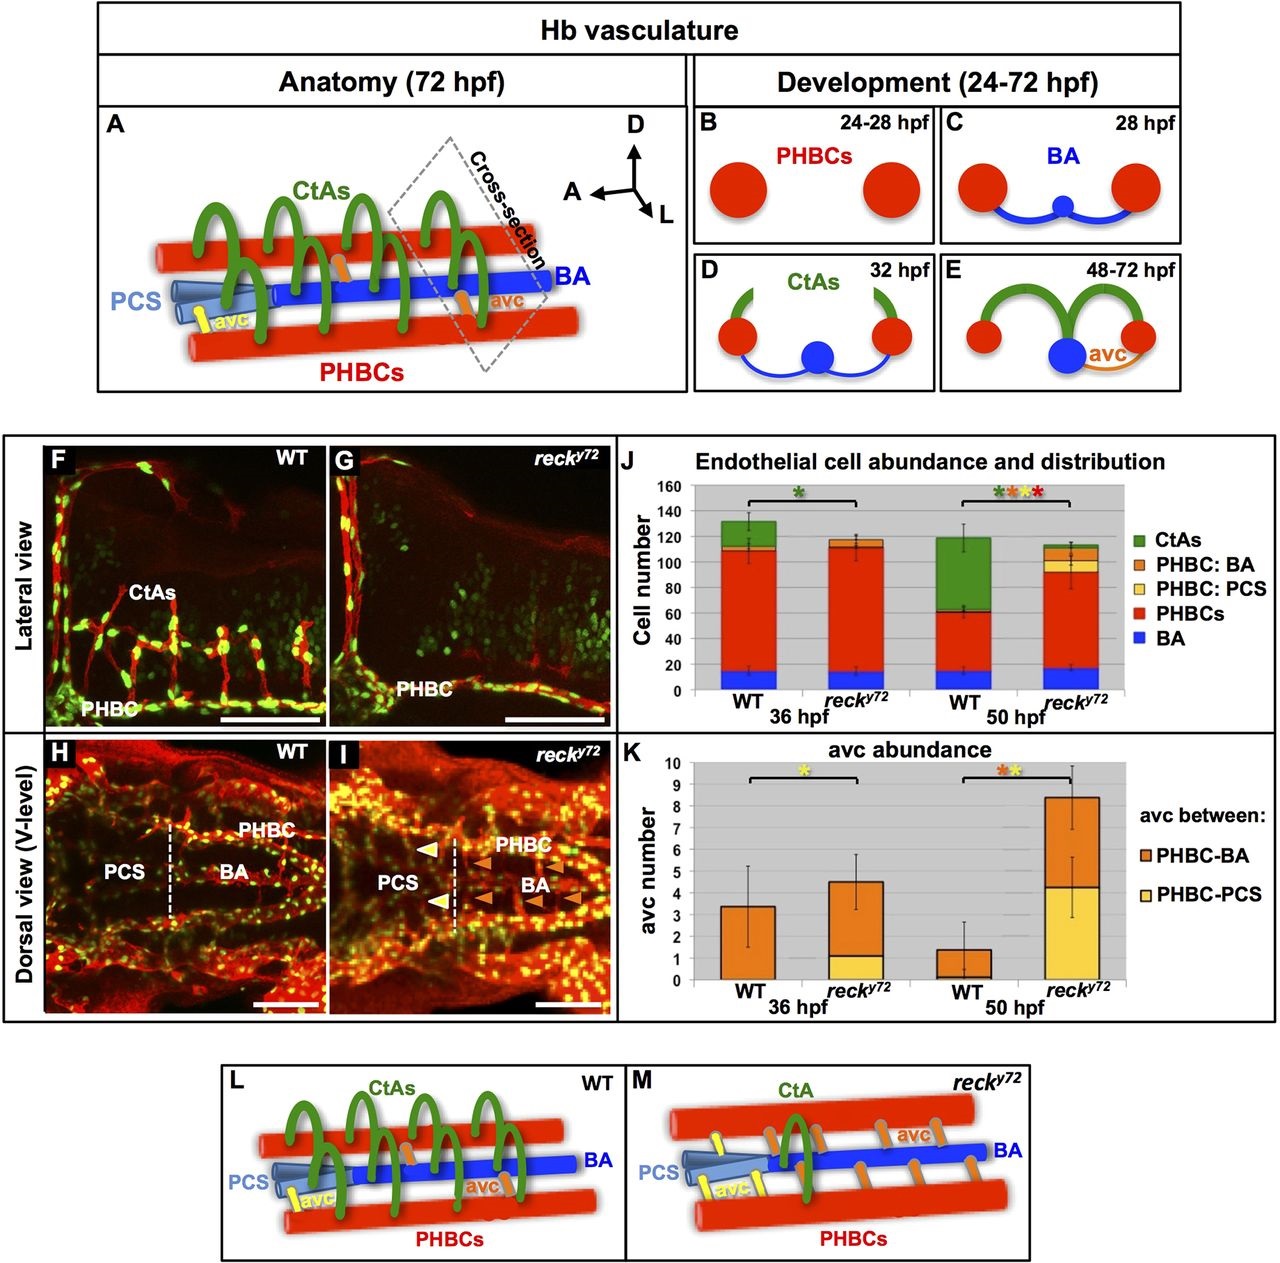
Fig. 4
CtA deficit in reck y72 mutant embryos is due to impaired endothelial cell migration from the perineural PHBCs. (A-E) WT Hb vasculature anatomy (A; anterior half detail) and development (B-E; cross-sections ‘cut’ along plane in A. Dorsal, up. PHBCs, red; BA, dark blue; PCS, light blue; avcs (PCS-connected, yellow; BA-connected, orange), CtAs; green. (F-K) Abundance and distribution of Hb endothelial cells and avcs at 36 and 50hpf in WT and reck y72 embryos. (F-I) Confocal images (50hpf). Endothelium, red [Tg(kdrl:RFP)s896]; endothelial nuclei, green [Tg(kdrl:eGFP-NLS)zf109]. Anterior, left. Scale bars: 100µm. (F,G) Lateral views; dorsal, up. (H,I) Dorsal views (ventral level) of extracerebral vessels; left side, bottom. Arrowheads, avcs (PCS-connected, yellow; BA-connected, orange). (J,K) Quantification and distribution of endothelial cells (J) and abundance of avcs (K). Asterisks and bars are color matched. Asterisks indicate significant differences (P<0.001) between age-matched genotypes (Student′s t-test). n=10 embryos per genotype and stage. Error bars indicate s.d. (L,M) Diagrams of the Hb vasculature phenotypes (anterior half detail) in WT (L) and reck y72 embryos (M). The mutant shows a dramatic CtA deficit, hyperplastic PHBCs and too many avcs. See also Figs S4, S5, Movies 15, 16 and Table S2.