
|
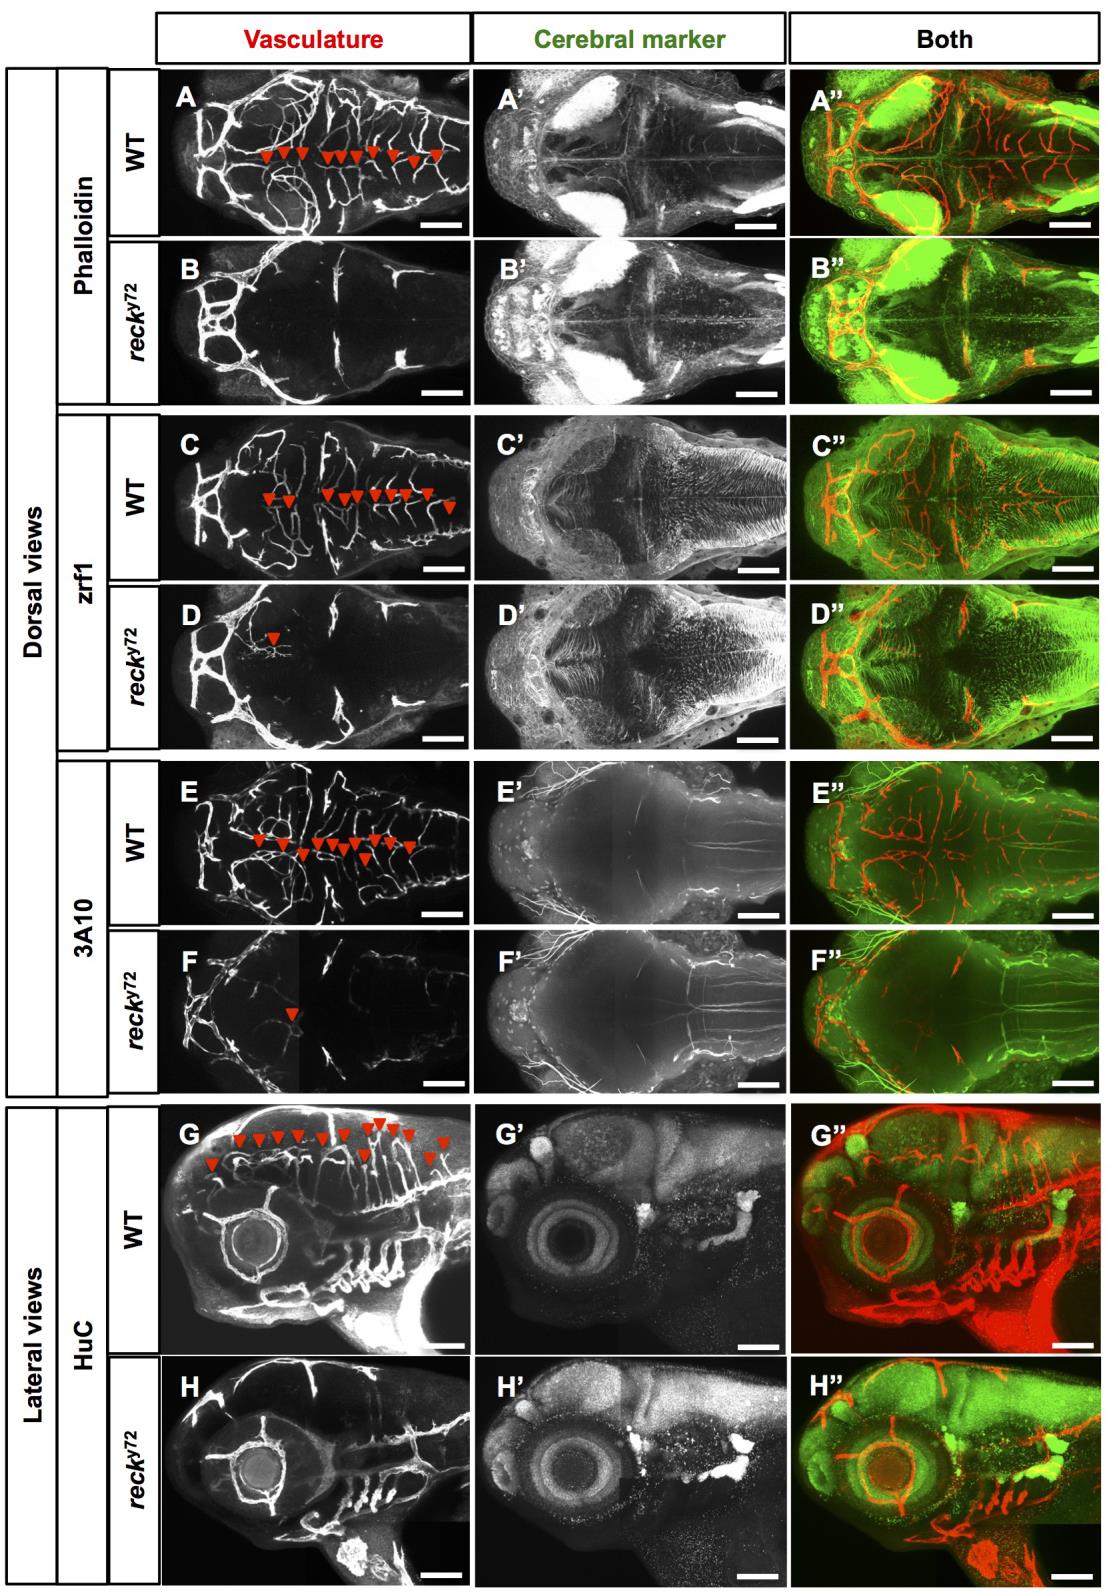
Fig. S1
Normal gross cerebral organization in recky72. (A-H′′) Confocal views; 72 hpf embryo heads. Anterior, left. (A-F′′′) Dorsal views; left side, bottom. (G-H′′) Lateral views; dorsal, up. Scale Bar: 100 µm. Genotypes, vasculature and cerebral markers as indicated. Vasculature: Tg(kdrl:RFP)s896 or Tg(kdrl:eGFP)1a116. Cerebral markers: phalloidin staining (labels F-actin at the interface of actin subunits), zrf1 (radial glia), 3A10 (labels a subset of hindbrain spinal cord projecting neurons, including Mauthner neurons) and HuC (pan-neuronal marker) immunofluorescence; see (Brand et al., 1996; Kim et al., 1996; Lowery et al., 2009)(Ulrich et al., 2011).