
- Title
-
Zebrafish homologs of 16p11.2, a genomic region associated with brain disorders, are active during brain development, and include two deletion dosage sensor genes
- Authors
- Blaker-Lee, A., Gupta, S., McCammon, J.M., De Rienzo, G., and Sive, H.
- Source
- Full text @ Dis. Model. Mech.
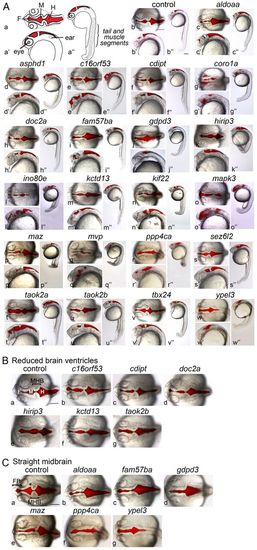
Loss of function (LOF) embryos have abnormal brain and tail morphology. (A) Embryonic phenotypes were observed at 24 hpf, after LOF was caused by injection of antisense MOs (supplementary material Table S2) at the one- to two-cell stage (supplementary material Table S3). Genes assayed (supplementary material Table S1) are indicated above each set of images. ‘Control’ embryos were injected with control MO (see Methods). Brain ventricles were injected with Texas Red dextran, and bright-field and fluorescence images superimposed. Images are representative of the phenotypes observed in at least 70% of embryos, over two to seven independent experiments, with 50–350 embryos assayed in total per gene (supplementary material Table S3). (Aa-Aw) Dorsal views; (Aa′-Aw′) lateral close-up; (Aa′′-Aw′′) full-embryo lateral view. (Aa-Aa′′) Schematics of embryo landmarks. F, forebrain ventricle; M, midbrain ventricle; H, hindbrain ventricle. (Ab-Aw, Ab′-Aw′) Anterior to the left, and images are shown at equivalent magnification. (B) Phenotypic group for which LOF embryos have narrow midbrain and hindbrain ventricles. The gene assayed is indicated above each panel. Dorsal views, anterior to the left. F, forebrain ventricle; M, midbrain ventricle; H, hindbrain ventricle; MHB, midbrain-hindbrain boundary. (C) Phenotypic group for which LOF embryos have a straight midbrain. The gene assayed is indicated above each panel. Dorsal views, anterior to the left. FB, forebrain; MHB, midbrain-hindbrain boundary; asterisk, midbrain hingepoint. Scale bars: 150 μm. Embryo images in B and C are the dorsal view of panels of A except for the control embryo and the gdpd3 LOF embryo in C. PHENOTYPE:
|
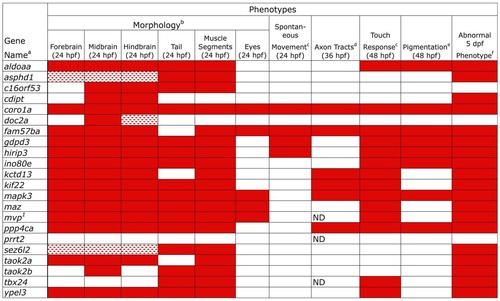
Phenotypes obtained after LOF of zebrafish 16p11.2 homologs. Embryonic phenotypes observed after LOF (Fig. 2) are catalogued, and structures or assays are indicated at the top of each column. All assays were performed in comparison with embryos injected with control MO. Quantification of phenotypes is given in supplementary material Table S3, and rescue conditions are shown in Fig. 4 and Table 3. aGenes assayed are indicated in the left column and gene identifiers are included in supplementary material Table S1. MOs targeting these genes are included in supplementary material Table S2. bMorphological analyses addressed head morphology (brain ventricle shape and eye formation), tail shape and length, and muscle segment shape (chevron vs U-shape). cTwo types of movement were tested: spontaneous movement at 24 hpf and touch response at 48 hpf. The ino80e LOF embryos respond with one flip of the tail or not at all. mapk3 LOF embryos have a jerky response and the ypel3 LOF embryos move in small, jerky circles. mvp LOF embryos range from not responding to spinning in response to touch. Otherwise, touch response was weak, sluggish or not responsive. dInitial axon tracts form by 36 hpf and were assayed by immunostaining for acetylated tubulin. Axon tracts were not assayed in mvp LOF embryos owing to lack of rescue, in prrt2 LOF owing to lack of observable phenotype at these time points, and in tbx24 LOF owing to lack of head expression. ePigmentation was observed at 48 hpf in LOF embryos and images are included in supplementary material Fig. S3. fPersistence of early phenotypic abnormalities was monitored up to 5 dpf. 1The mvp MO used for the phenotype reported is indicated with matching superscript and listed first in Table 1 and supplementary material Table S2. Red boxes: abnormal phenotype in >70% embryos; speckled red boxes: abnormal phenotype in >70% of embryos, but the phenotype was mild. ND, not determined. |
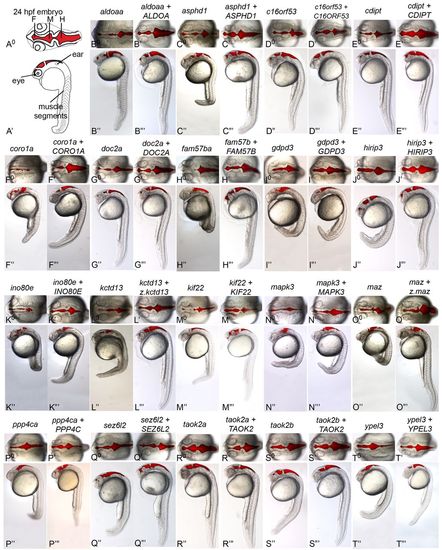
Human orthologs rescue zebrafish LOF embryos. Single-cell embryos were injected with MO, either alone or together with human or fish mRNA, and imaged at 24 hpf after injecting Texas Red dextran into the brain ventricles. The restoration of a LOF phenotype to normal by co-injection of the human homolog with a zebrafish LOF indicates functional equivalence of the human and zebrafish gene (orthology). kctd13 (L′ ′′-L′ ′′) and maz (O′ ′′-O′ ′′) LOF phenotypes were rescued by zebrafish but not human RNA. (B′ ′′-T′ ′′) Dorsal views and (B′′-T′′) lateral views of LOF embryos. (B′-T′) Dorsal views and (B′ ′′-T′ ′′) lateral views of LOF embryos plus rescue mRNA. Human RNAs co-injected for rescue are indicated by uppercase letters, except for z.kctd13 and z.maz, which refer to RNA from the zebrafish genes. The rescue experiments shown in D, E and G are from the experiment shown in Fig. 2; in other cases, the images are taken from different experiments, with data consistent to that shown in Fig. 2. Images are representative of two to four independent experiments per gene, with 40–194 embryos assayed in total per gene. Rescue of the abnormal LOF phenotypes was achieved in <50% or more of the embryos. Representative images are shown here and quantification is included in Table 3. F, forebrain ventricle; M, midbrain ventricle; H, hindbrain ventricle. |
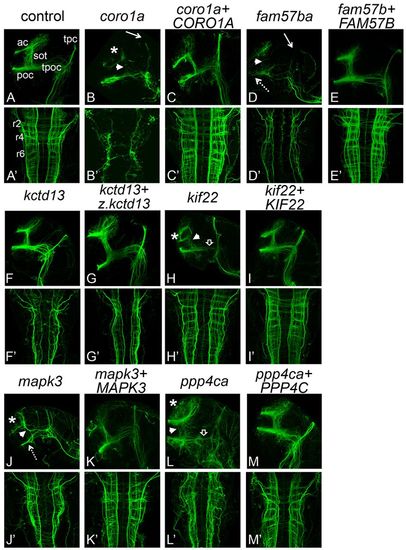
Axon tracts are abnormal in LOF embryos. Forebrain and hindbrain axon tracts after LOF. Axons were labeled with anti-acetylated α-tubulin antibody and imaged by scanning confocal microscopy of fixed, flat-mounted 36 hpf LOF embryos. (A-M) Lateral view, showing forebrain axons. (A′-M′) Dorsal view, showing hindbrain axons. Genes targeted for LOF by MO injection are indicated above each set of panels in lowercase. Over two independent experiments, an average of eight embryos per gene were imaged for effects of LOF and rescue. The percentage of affected embryos was 80% or greater. Hindbrain and forebrain tracts were affected in all LOF conditions, except kctd13, which only showed defects in the hindbrain, and kif22, which only showed defects in the forebrain. The rescues with cognate RNA led to rescue in 75–100% of embryos assayed. Human RNAs co-injected for rescue are indicated by uppercase letters, except for z.kctd13, which refers to RNA from the zebrafish gene. ‘Control’ embryos were injected with control MO (see Methods). ac, anterior commissures; sot, supra optic tract; poc, post optic commissure; tpoc, tract of the post optic commissure; tpc, tract of the posterior commissure; r2, r4, r6, rhombomeres 2, 4, and 6; asterisk, reduced or disorganized ac; white arrowhead, reduced or disorganized sot; white arrow, reduced tpc; open arrowhead, reduced or disorganized tpoc; dotted arrow, reduced poc. PHENOTYPE:
|
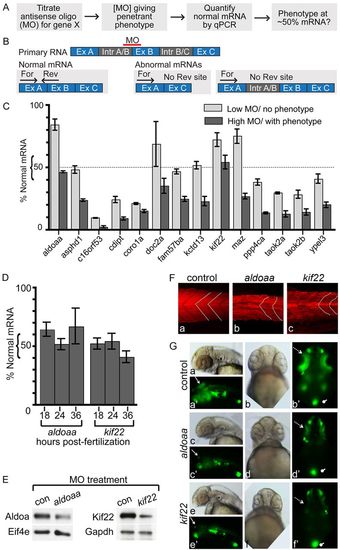
Identification of deletion dosage sensor genes. (A) Strategy for identification of deletion dosage sensor genes. MOs designed against splice sites are titrated to find the lowest amount resulting in a phenotype, with at least 70% penetrance, and normal RNA remaining at this MO concentration is determined. A ‘deletion dosage sensor’ is defined as a gene for which a phenotype is observed when <50% of the normal mRNA remains. (B) Strategy to quantify normal mRNA remaining in LOF embryos. An antisense MO is designed to an intron-exon boundary, and typically results in exon exclusion or intron inclusion (Table 2). qPCR primers are designed to detect the normally processed mRNA, where one primer in each set hybridizes to the normal but not the abnormally processed transcript. For, forward primer; Rev, reverse primer; Ex, exon; Intr, intron. (C) Percentage of normal mRNA remaining in 24 hpf LOF embryos. RNA levels were quantified by qPCR, normalized to ef1α and expressed relative to levels of experimental RNA in control-MO-injected embryos. LOF was performed at two MO concentrations, one that did not give a phenotype (‘Low MO’) and one that did (‘High MO’). Genes assayed are indicated below the relevant histograms. (D) Quantification of normal aldoaa and kif22 mRNA after LOF in 18, 24 and 36 hpf embryos, at the same MO concentration used in panel C. qPCR was performed and RNA levels normalized to ef1α and expressed relative to levels of experimental RNA in control-MO-injected embryos. (E) Western blots of 24 hpf LOF embryos, at the same MO concentration used in panel C. Representative image of three experiments is shown. Protein was extracted from embryos injected with aldoaa or kif22 MOs. After LOF, 56% of Aldoaa (from head-dissected protein, thus Aldoaa-enriched; see Methods) and 65% of Kif22 (whole embryo) protein remains when normalized to control proteins (Eif4e and Gapdh, respectively), compared with control-MO-injected embryos. (F) Muscle segments in 24 hpf LOF embryos. Actin is stained with phalloidin, and muscle shape is indicated by white dotted lines. Over two experiments, chevron shape was abnormal in 0% of control-MO-injected embryos, 100% aldoaaLOF embryos and 100% kif22 LOF embryos (n=10 for each condition). (G) GFP expression in the NeuroD:GFP line. 0% (n=106) control embryos (injected with control MO), 94% (n=97) aldoaa LOF embryos and 100% (n=100) kif22 LOF embryos were affected, as observed over four independent experiments. Dotted arrow, retina; arrow, tectum; oval, pancreas. (a–a′,c–c′,e–e′) Lateral view, anterior to the left; (b–b′,d–d′,f–f′) ventral view. |
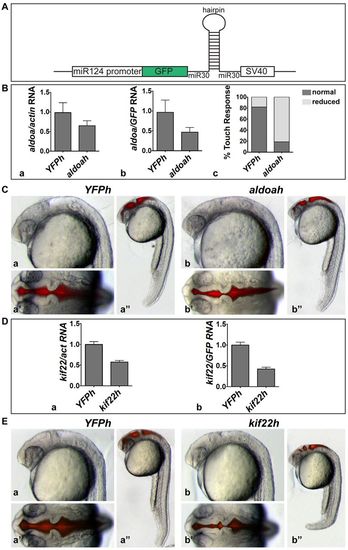
aldoaa and kif22 function are required in the brain. (A) shRNA expression strategy. shRNAs were expressed from a miR30 backbone, under the CNS-specific miR124 promoter. Transient transgenesis was induced using I-SceI meganuclease. (B) Relative expression of aldoaa mRNA after inhibition by shRNA. Expression was quantified by qPCR in 24 hpf embryos injected with an aldoaa hairpin (aldoah), shown relative to embryos injected with a control hairpin (YFPh). Data was normalized to either (Ba) actin or (Bb) GFP expression. (Bc) Touch response in 24 hpf aldoah embryos versus control YFPh embryos (81% abnormal, n=26). (C) Phenotype of shRNA-injected embryos. (Ca-Ca′′) 24 hpf control YFPh embryos (16% abnormal, n=51, in two independent experiments). (Cb-Cb′′) 24 hpf aldoah embryos (89% abnormal, n=53, in two independent experiments). (Ca,Cb) Lateral view of the head; (Ca′,Cb′) dorsal view of the head after brain ventricle injection; (Ca′′,Cb′′) lateral view of whole embryo. (D) Relative expression of kif22 mRNA after inhibition by shRNA. kif22 mRNA relative expression was quantified by qPCR in 24 hpf embryos injected with a kif22 hairpin (kif22h) relative to those injected with the YFPh control hairpin. Data was normalized to (Da) actin or (Db) GFP expression. (E) Phenotype of shRNA-injected embryos. (Ea-Ea′′) 24 hpf YFPh embryos (8% abnormal, n=27, in two independent experiments). (Eb-Eb′′) 24 hpf kif22h embryos (81% abnormal, n=26, in two independent experiments). (Ea,Eb) Lateral view of the head; (Ea′,Eb′) dorsal view of the head after brain ventricle injection; (Ea′′,Eb′′) lateral view of whole embryo. |
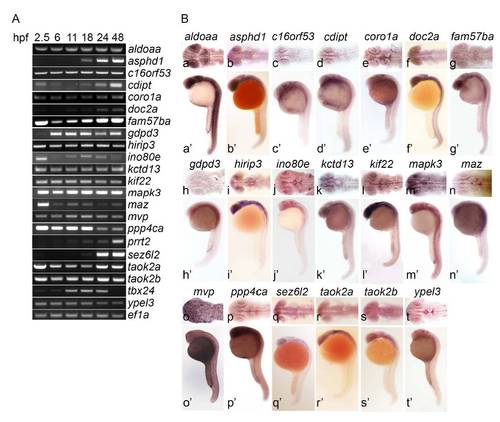
16p11.2 homologs are expressed during development and in the brain. (A) RNA expression analysis by RT-PCR. Total embryo RNA was analyzed for expression of 16p11.2 homologs at 2.5 hpf (blastula), 6 hpf (early gastrula), 11 hpf (late gastrula), 18 hpf (mid-somitogenesis), 24 hpf and 48 hpf. Most genes are expressed maternally, at 2.5 hpf, and expression persists zygotically (6 hpf and later). asphd1, doc2a, prrt2 and sez6L2 show zygotic expression only, suggesting that these genes act later in development. tbx24 expression declines sharply by 48 hpf, suggesting a narrow temporal activity window. Further, this gene is not expressed in brain. (8) Spatial expression analysis by whole mount in situ hybridization. Gene expression was analyzed at 24 hpf (see Methods and Table S4). (a-t) dorsal view, (a′-t′) lateral view. All genes except tbx24 were expressed in the brain. |
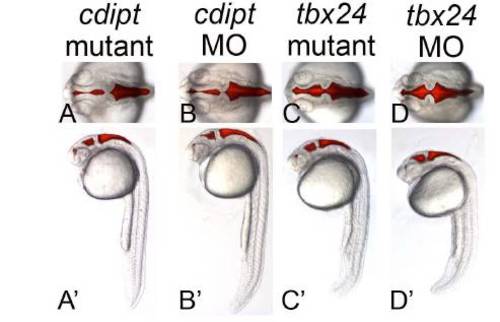
Similar phenotypes after LOF by MO injection and in genetic mutants. (A, A′) cdipthi559Tglhi559Tg were scored by genotyping (see Methods for details). (8, 8′) cdipt antisense morpholino LOF embryo. In both cases, embryos have a narrow forebrain and midbrain ventricle. (C-C′) tbx24te3141te314 were scored by morphology. (0-0′) tbx24 antisense morpholino LOF embryo. In both cases, fused muscle segment borders and shorter tails are apparent. (A-D) dorsal view, (A′-D′) lateral view. PHENOTYPE:
|
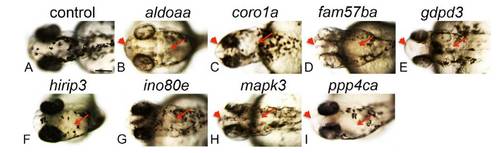
Pigmentation is abnormal in LOF embryos. Pigment cells were observed after LOF, at 48 hpf, by brightfield imaging. Rostral and midline cells were specifically scored as a measure of normal melanocyte migration. (A-I) dorsal views. Genes targeted for LOF by MO injection are indicated above each set of panels. Red arrowhead, no rostral pigment cells; red arrow, no midline pigment cells; scale bar, 150 μM. Average of 35 embryos assayed per gene, over 2-4 independent experiments, 70-100% affected compared to control MO-injected embryos. PHENOTYPE:
|