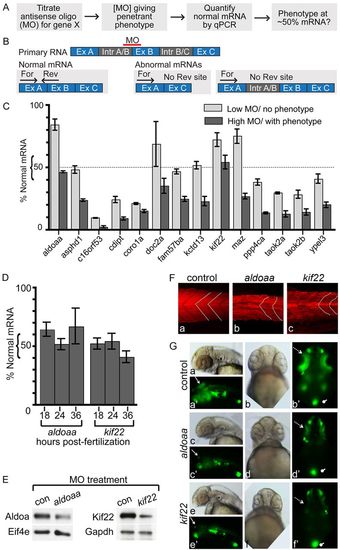
Identification of deletion dosage sensor genes. (A) Strategy for identification of deletion dosage sensor genes. MOs designed against splice sites are titrated to find the lowest amount resulting in a phenotype, with at least 70% penetrance, and normal RNA remaining at this MO concentration is determined. A ‘deletion dosage sensor’ is defined as a gene for which a phenotype is observed when <50% of the normal mRNA remains. (B) Strategy to quantify normal mRNA remaining in LOF embryos. An antisense MO is designed to an intron-exon boundary, and typically results in exon exclusion or intron inclusion (Table 2). qPCR primers are designed to detect the normally processed mRNA, where one primer in each set hybridizes to the normal but not the abnormally processed transcript. For, forward primer; Rev, reverse primer; Ex, exon; Intr, intron. (C) Percentage of normal mRNA remaining in 24 hpf LOF embryos. RNA levels were quantified by qPCR, normalized to ef1α and expressed relative to levels of experimental RNA in control-MO-injected embryos. LOF was performed at two MO concentrations, one that did not give a phenotype (‘Low MO’) and one that did (‘High MO’). Genes assayed are indicated below the relevant histograms. (D) Quantification of normal aldoaa and kif22 mRNA after LOF in 18, 24 and 36 hpf embryos, at the same MO concentration used in panel C. qPCR was performed and RNA levels normalized to ef1α and expressed relative to levels of experimental RNA in control-MO-injected embryos. (E) Western blots of 24 hpf LOF embryos, at the same MO concentration used in panel C. Representative image of three experiments is shown. Protein was extracted from embryos injected with aldoaa or kif22 MOs. After LOF, 56% of Aldoaa (from head-dissected protein, thus Aldoaa-enriched; see Methods) and 65% of Kif22 (whole embryo) protein remains when normalized to control proteins (Eif4e and Gapdh, respectively), compared with control-MO-injected embryos. (F) Muscle segments in 24 hpf LOF embryos. Actin is stained with phalloidin, and muscle shape is indicated by white dotted lines. Over two experiments, chevron shape was abnormal in 0% of control-MO-injected embryos, 100% aldoaaLOF embryos and 100% kif22 LOF embryos (n=10 for each condition). (G) GFP expression in the NeuroD:GFP line. 0% (n=106) control embryos (injected with control MO), 94% (n=97) aldoaa LOF embryos and 100% (n=100) kif22 LOF embryos were affected, as observed over four independent experiments. Dotted arrow, retina; arrow, tectum; oval, pancreas. (a–a′,c–c′,e–e′) Lateral view, anterior to the left; (b–b′,d–d′,f–f′) ventral view.
|
