
Fig. 3
- ID
- ZDB-FIG-121212-42
- Publication
- Blaker-Lee et al., 2012 - Zebrafish homologs of 16p11.2, a genomic region associated with brain disorders, are active during brain development, and include two deletion dosage sensor genes
- Other Figures
- All Figure Page
- Back to All Figure Page
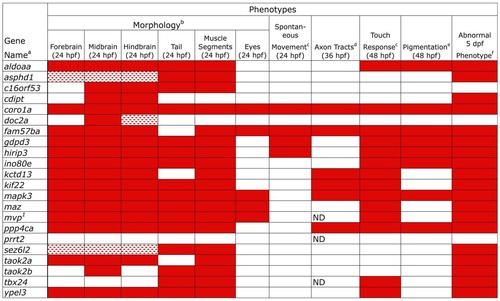
Phenotypes obtained after LOF of zebrafish 16p11.2 homologs. Embryonic phenotypes observed after LOF (Fig. 2) are catalogued, and structures or assays are indicated at the top of each column. All assays were performed in comparison with embryos injected with control MO. Quantification of phenotypes is given in supplementary material Table S3, and rescue conditions are shown in Fig. 4 and Table 3. aGenes assayed are indicated in the left column and gene identifiers are included in supplementary material Table S1. MOs targeting these genes are included in supplementary material Table S2. bMorphological analyses addressed head morphology (brain ventricle shape and eye formation), tail shape and length, and muscle segment shape (chevron vs U-shape). cTwo types of movement were tested: spontaneous movement at 24 hpf and touch response at 48 hpf. The ino80e LOF embryos respond with one flip of the tail or not at all. mapk3 LOF embryos have a jerky response and the ypel3 LOF embryos move in small, jerky circles. mvp LOF embryos range from not responding to spinning in response to touch. Otherwise, touch response was weak, sluggish or not responsive. dInitial axon tracts form by 36 hpf and were assayed by immunostaining for acetylated tubulin. Axon tracts were not assayed in mvp LOF embryos owing to lack of rescue, in prrt2 LOF owing to lack of observable phenotype at these time points, and in tbx24 LOF owing to lack of head expression. ePigmentation was observed at 48 hpf in LOF embryos and images are included in supplementary material Fig. S3. fPersistence of early phenotypic abnormalities was monitored up to 5 dpf. 1The mvp MO used for the phenotype reported is indicated with matching superscript and listed first in Table 1 and supplementary material Table S2. Red boxes: abnormal phenotype in >70% embryos; speckled red boxes: abnormal phenotype in >70% of embryos, but the phenotype was mild. ND, not determined. |
| Fish: | |
|---|---|
| Knockdown Reagents: | |
| Observed In: | |
| Stage Range: | Prim-5 to Long-pec |