
- Title
-
A complex choreography of cell movements shapes the vertebrate eye
- Authors
- Kwan, K.M., Otsuna, H., Kidokoro, H., Carney, K.R., Saijoh, Y., and Chien, C.B.
- Source
- Full text @ Development
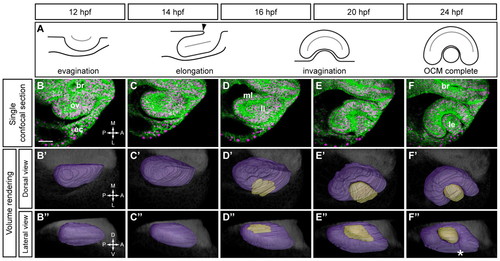
Timecourse of optic cup morphogenesis in zebrafish. (A) Schematic of optic cup morphogenesis (OCM), dorsal view. Arrowhead, furrow constricting the optic stalk. (B-F) Single confocal slices from 4D dataset of right optic vesicle (OV) at 12-24 hpf showing EGFP-CAAX (membranes, green) and H2A.F/Z-mCherry (nuclei, magenta). Dorsal views. (B2-F2,B3-F3) Volume renderings. OV (purple), lens (beige), brain (gray). (B2-F2) Dorsal views. (B3-F3) Lateral views. Asterisk, choroid fissure. br, brain; ov, optic vesicle; ec, ectoderm; ml, medial layer; ll, lateral layer; le, lens; A, anterior; P, posterior; M, medial; L, lateral; D, dorsal; V, ventral. Scale bar: 50 μm. |
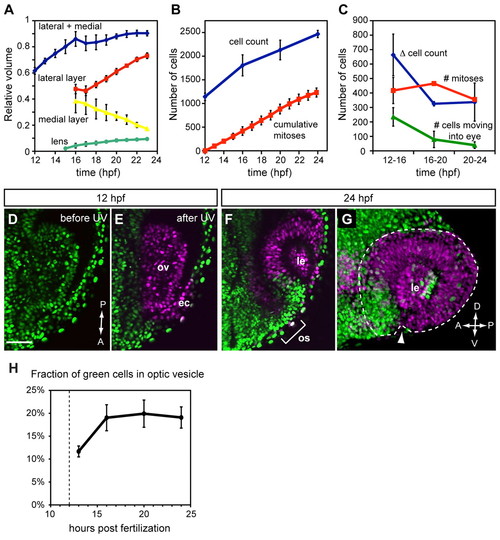
Quantitative analysis of growth, proliferation and extended evagination during OCM. (A) Relative volume of OV (blue), OV lateral layer (red), OV medial layer (yellow) and lens (green) as a fraction of final volume (OV plus lens). n=3. (B) Cell count (blue) and mitoses (red). n=2. (C) Cell count change (blue), mitoses (red) and number of cells moving into eye (green). n=2 for cell count and mitoses; n=3 for evagination. (D) Single confocal section (dorsal view) of OV at 12 hpf showing nls-Kaede (green) before photoactivation. (E) After photoactivation, the entire OV (and some ectoderm) is converted to red (magenta). (F) Single confocal section (dorsal view) of the same embryo at 24 hpf showing green nuclei in the anterior OC and optic stalk. (G) A 3D-rendered lateral view of same OC. Arrowhead, choroid fissure. The optic cup is outlined. (H) Quantification of extended evagination showing the fraction of green cells within the OV (n=3). Dashed line indicates the time of photoactivation (12 hpf). Only OV cells, not overlying lens/ectoderm, were counted. ec, ectoderm; ov, optic vesicle; os, optic stalk; le, lens. Error bars indicate s.d. Scale bar: 50 μm. |
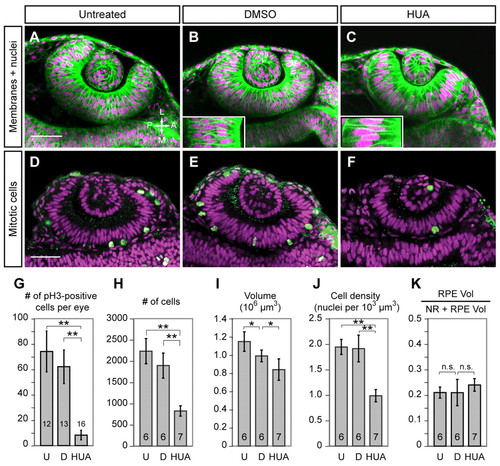
Proliferation is dispensable for OCM. (A-C) Confocal sections (live, 24-hpf) showing EGFP-CAAX (membranes, green) and H2A.F/Z-mCherry (nuclei, magenta). (A) Untreated, (B) DMSO and (C) HUA embryos treated from 10.5-24 hpf. Insets show large HUA-treated cells versus DMSO control. (D-F) Confocal sections at 24 hpf showing phospho-histone H3 (green) and TO-PRO-3 (magenta) in (D) untreated, (E) DMSO-treated and (F) HUA-treated embryos. Dorsal view. (G-K) Quantitative analyses of (G) mitoses, (H) cell number, (I) OV volume, (J) cell density and (K) retinal pigmented epithelium (RPE) volume as a fraction of OC [neural retina (NR) plus RPE] at 24 hpf in untreated (U), DMSO-treated (D) and HUA-treated embryos. Numbers of embryos scored (one eye each) are indicated within each bar. *, P<0.05; **, P<0.01; error bars indicate s.d. Scale bars: 50 μm. |
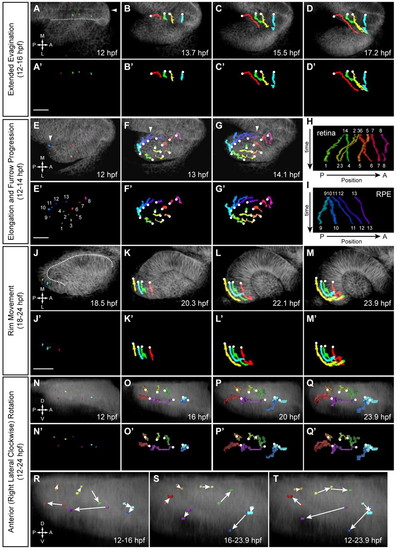
Four major retinal cell movements during OCM. (A-D2) Extended evagination (12-16 hpf). Cells are moving from brain to eye. Arrowhead, embryo midline; dotted line, OV/brain boundary. (A-D) Trajectories over membrane channel average projection (grayscale). (A2-D2) Trajectories only. (E-G2) OV elongation (12-14 hpf). Thirteen cells (1-8 NR, 9-13 RPE) undergoing pinwheel movement. Arrowhead, leading edge of furrow. (E-G) Trajectories over membrane channel average (grayscale). (E2-G2) Trajectories only. (H,I) Kymographs showing change in AP position over time for NR (H) and RPE (I) cells. (J-M2) Rim movement (18-24 hpf). Cells are moving from the medial to lateral layer. (J-M) Trajectories over membrane channel average (grayscale). (J2-M2) Trajectories only. Dotted line (J) demarcates the medial and lateral layers. (N-Q2) Eye rotation (12-24 hpf). (N-Q) Trajectories over volume rendering of membrane channel (grayscale). (N2-Q2) Trajectories only. (R-T) Rotation summaries for (R) 12-16 hpf, (S) 16-23.9 hpf and (T) 12-23.9 hpf. White circles indicate origins. (A-G2,J-M2) Dorsal view. (N-T) Lateral view. Scale bars: 50 μm. |
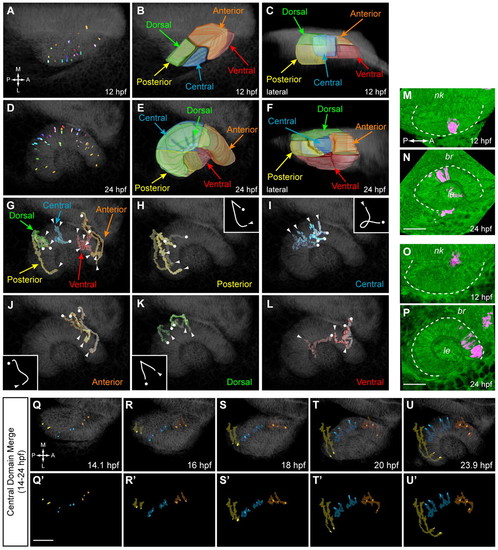
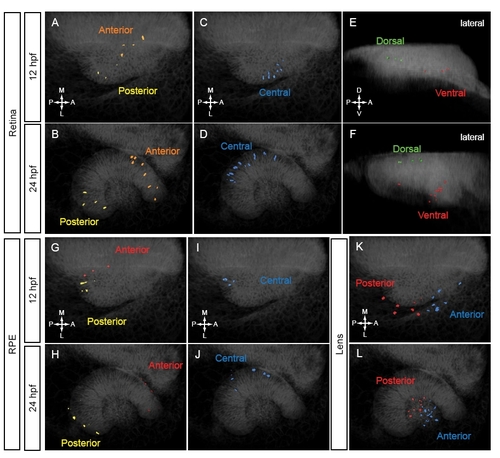
Origin and movement of retinal subdomains. (A,D) Positions of tracked NR cells at 12 (A) and 24 (D) hpf. Dorsal views. (B,C) Volume rendering of retinal subdomains (12 hpf): posterior (yellow), central (blue), anterior (orange), dorsal (green) and ventral (red). (B) Dorsal view. (C) Lateral view. (E,F) Volume rendering of retinal subdomains (24 hpf). (E) Dorsal view. (F) Lateral view. (G-L) Retinal subdomain trajectories. Dorsal view. Circles indicate origins; arrowheads indicate termini. (G) Summary. (H-L) Individual subdomains. Insets illustrate typical trajectory shape, except for ventral, which has none. (M-P) Kaede fate mapping. Dorsal views, volume renderings. (M,O) OV at 12 hpf; photoactivated spot, magenta. (N,P) Final position after OCM (24 hpf). (M,N) Central domain. (O,P) Anterior domain. Dashed lines outline OV (12 hpf) and OC (24 hpf). (Q-U2) Central domain merge (14-24 hpf): posterior (yellow), central (blue) and anterior (orange) trajectories. Dorsal views. (Q-U) Trajectories over membrane channel average (grayscale). (Q2-U2) Trajectories alone. nk, neural keel; br, brain; le, lens. Scale bars: 50 μm. |
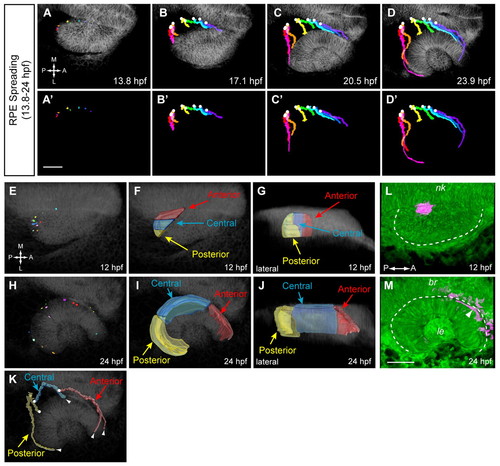
RPE cell movements and origin of RPE subdomains. (A-D2) RPE spreading (13.8-24 hpf). Dorsal view. (A-D) Trajectories over membrane channel average (grayscale). (A2-D2) Trajectories alone. Circles indicate origins. (E,H) Positions of tracked RPE cells at 12 (E) and 24 (H) hpf. Dorsal view. (F,G) Volume rendering of RPE subdomains (12 hpf); posterior (yellow), central (blue), anterior (red). (F) Dorsal view. (G) Lateral view. (I,J) Volume rendering of RPE subdomains (24 hpf). (I) Dorsal view. (J) Lateral view. (K) RPE subdomain trajectories (dorsal view). Circles indicate origins; arrowheads indicate termini. (L,M) Kaede fate mapping. Dorsal views. Volume renderings. (L) OV (12 hpf); photoactivated spot, magenta. (M) Final position after OCM (24 hpf) as indicated by arrowhead. Dashed line outlines OV (12 hpf) and OC (24 hpf). nk, neural keel; br, brain; le, lens. Scale bars: 50 μm. |
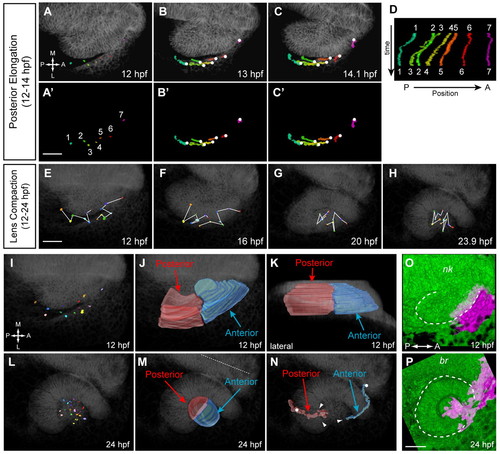
Lens cell movements and origin of lens domains. (A-C2) OV elongation (12-14 hpf). Dorsal views. (A-C) Trajectories over membrane channel average (grayscale). (A2-C2) Trajectories alone. Circles indicate origins. (D) Kymograph showing change in cell AP position over time. (E-H) Lens compaction and cell mixing (12-24 hpf). Dorsal views. (I,L) Positions of tracked lens cells at 12 (I) and 24 (L) hpf. Dorsal views. (J,K) Volume rendering of lens subdomains (12 hpf); posterior (red), anterior (blue). (J) Dorsal view. (K) Lateral view. (M) Volume rendering of lens subdomains (24 hpf). Dorsal view. Dotted line indicates midline. (N) Lens subdomain trajectories (dorsal view). Circles indicate origins; arrowheads indicate termini. (O,P) Kaede fate mapping. Dorsal views. Volume renderings. (O) OV (12 hpf); photoactivated region, magenta. (P) Final position after OCM (24 hpf). Dashed line outlines OV (12 hpf) and OC (24 hpf). nk, neural keel; br, brain. Scale bars: 50 μm. |
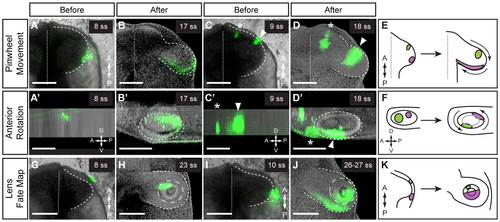
Conservation of movements in chick OCM. (A-F) Pinwheel movement and anterior rotation. Lateral (A,A2) or anterior (C,C2) OV was labeled and imaged immediately. (A,C) Ventral views. (A2,C2) Lateral views. (C) Two anterior DiI spots were marked: medial spot (asterisk), brain; lateral spot (arrowhead), OV. The lateral DiI spot moved medially (B) and dorsally (B2). The anterior DiI spot (arrowhead) moved laterally (D) and ventrally (D2). (B,D) Ventral views. (B2,D2) Lateral views. Dashed line outlines OV; dotted line indicates the midline. (E) Summary of pinwheel movement. (F) Summary of anterior rotation. (G-K) Lens fate map. Anterior (G) or posterior (I) ectoderm was labeled and imaged immediately. Ventral view. Dashed line outlines OV; dotted line indicates the midline. (H,J) The DiI label was found in distinct lens domains. Ventral view. Dashed line outlines OV; long-dashed line outlines lens. (K) Summary of lens fate map. Volume renderings: DiI and brightfield (A,A2,C,C2,G,I) or DiI and nuclear counterstain (B,B2,D,D2,H,J). Scale bars: 200 μm. |
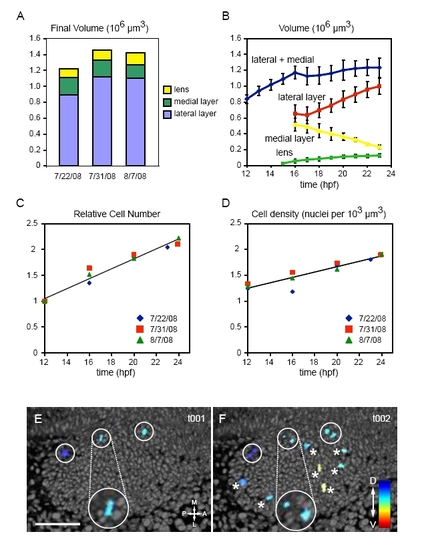
Quantitation of eye volume, cell count and mitoses. (A) Eye domain absolute volumes (24 hpf) for the three datasets. (B) Absolute volumes of the eye and domains over time. n=3; error bars, s.d. (C) Relative cell count over time (n=3). (D) Cell density over time (n=3). (E,F) Mitosis visualization in 4D datasets. Three-dimensional rendering of nuclei (grayscale) and mitoses (color). (E) Time point t001. Circles, metaphase plates. (F) Time point t002. Circles, daughter nuclei from previous time point; asterisks, new metaphase plates. Dorsal views. Insets show chromatin morphology. Scale bar: 50 μm. |
Clustering of tracked cells. Tracked cells were assigned to domains based on final position (24 hpf) and trajectory shape. Volume renderings of tracked nuclei at 12 (A,C,E,G,I,K) and 24 (B,D,F,H,J,L) hpf. (A-F) Retinal nuclear positions. (A,B) Anterior and posterior domains. Dorsal view. (C,D) Central domain. Dorsal view. (E,F) Dorsal and ventral domains. Lateral view. (G-J) RPE nuclear positions. (G,H) Anterior and posterior domains. Dorsal view. (I,J) Central domain. Dorsal view. (K,L) Lens nuclear positions. Anterior and posterior domains. |