
Fig. 7
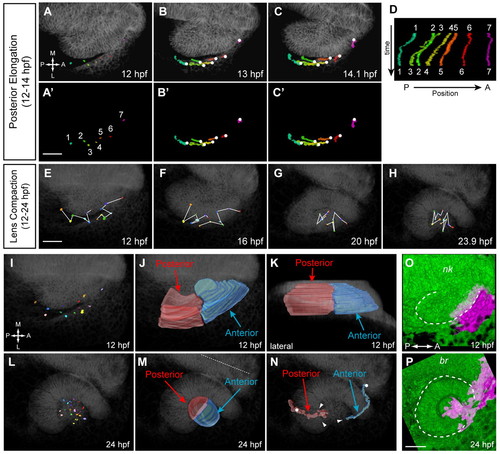
Lens cell movements and origin of lens domains. (A-C2) OV elongation (12-14 hpf). Dorsal views. (A-C) Trajectories over membrane channel average (grayscale). (A2-C2) Trajectories alone. Circles indicate origins. (D) Kymograph showing change in cell AP position over time. (E-H) Lens compaction and cell mixing (12-24 hpf). Dorsal views. (I,L) Positions of tracked lens cells at 12 (I) and 24 (L) hpf. Dorsal views. (J,K) Volume rendering of lens subdomains (12 hpf); posterior (red), anterior (blue). (J) Dorsal view. (K) Lateral view. (M) Volume rendering of lens subdomains (24 hpf). Dorsal view. Dotted line indicates midline. (N) Lens subdomain trajectories (dorsal view). Circles indicate origins; arrowheads indicate termini. (O,P) Kaede fate mapping. Dorsal views. Volume renderings. (O) OV (12 hpf); photoactivated region, magenta. (P) Final position after OCM (24 hpf). Dashed line outlines OV (12 hpf) and OC (24 hpf). nk, neural keel; br, brain. Scale bars: 50 μm. |