
Fig. 1
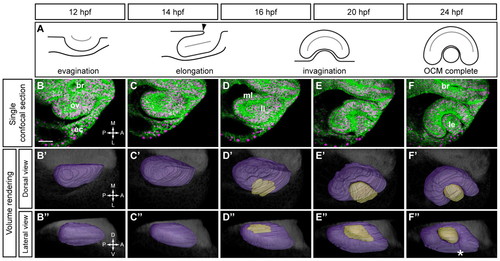
Timecourse of optic cup morphogenesis in zebrafish. (A) Schematic of optic cup morphogenesis (OCM), dorsal view. Arrowhead, furrow constricting the optic stalk. (B-F) Single confocal slices from 4D dataset of right optic vesicle (OV) at 12-24 hpf showing EGFP-CAAX (membranes, green) and H2A.F/Z-mCherry (nuclei, magenta). Dorsal views. (B2-F2,B3-F3) Volume renderings. OV (purple), lens (beige), brain (gray). (B2-F2) Dorsal views. (B3-F3) Lateral views. Asterisk, choroid fissure. br, brain; ov, optic vesicle; ec, ectoderm; ml, medial layer; ll, lateral layer; le, lens; A, anterior; P, posterior; M, medial; L, lateral; D, dorsal; V, ventral. Scale bar: 50 μm. |