
Fig. 4
- ID
- ZDB-IMAGE-120202-10
- Publication
- Kwan et al., 2012 - A complex choreography of cell movements shapes the vertebrate eye
- All Figures
- Figures for Kwan et al., 2012
|
Fig. 4
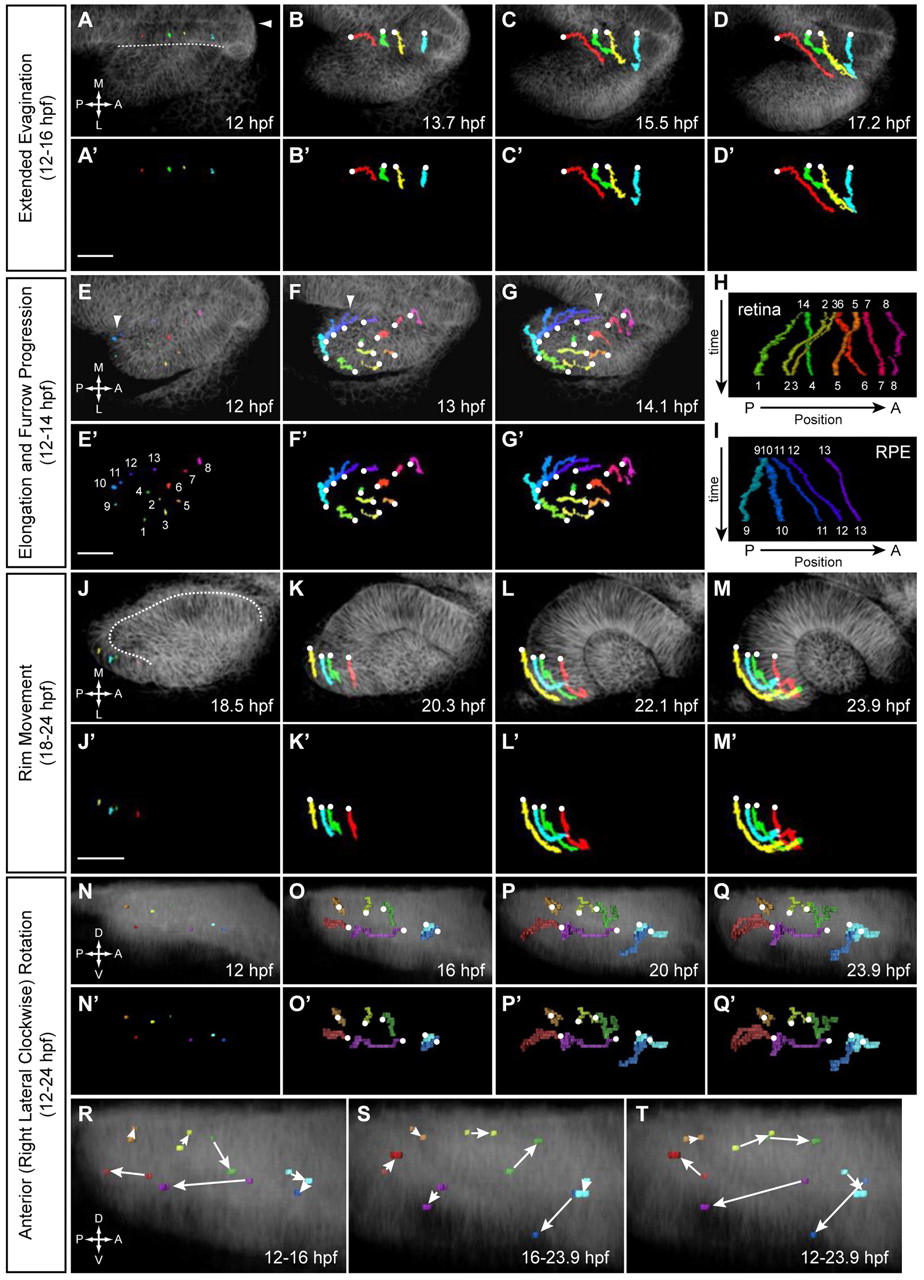
Four major retinal cell movements during OCM. (A-D2) Extended evagination (12-16 hpf). Cells are moving from brain to eye. Arrowhead, embryo midline; dotted line, OV/brain boundary. (A-D) Trajectories over membrane channel average projection (grayscale). (A2-D2) Trajectories only. (E-G2) OV elongation (12-14 hpf). Thirteen cells (1-8 NR, 9-13 RPE) undergoing pinwheel movement. Arrowhead, leading edge of furrow. (E-G) Trajectories over membrane channel average (grayscale). (E2-G2) Trajectories only. (H,I) Kymographs showing change in AP position over time for NR (H) and RPE (I) cells. (J-M2) Rim movement (18-24 hpf). Cells are moving from the medial to lateral layer. (J-M) Trajectories over membrane channel average (grayscale). (J2-M2) Trajectories only. Dotted line (J) demarcates the medial and lateral layers. (N-Q2) Eye rotation (12-24 hpf). (N-Q) Trajectories over volume rendering of membrane channel (grayscale). (N2-Q2) Trajectories only. (R-T) Rotation summaries for (R) 12-16 hpf, (S) 16-23.9 hpf and (T) 12-23.9 hpf. White circles indicate origins. (A-G2,J-M2) Dorsal view. (N-T) Lateral view. Scale bars: 50 μm.